

Question: Create a table in Excel and solve for the following: What percentage of students had an overall grade above 80%? How many students had a
Create a table in Excel and solve for the following:
- What percentage of students had an overall grade above 80%?
- How many students had a grade of B+ or higher?
In the table in Excel, you must use the SumProduct formula initially to calculate each students grade, and then use VLookup to enter the letter grade.
Next create a pivot table showing only the major, status (freshman or sophomore) and letter grade. Try to create multiple pivot tables on different sheets in your Excel file. Play around with different items in columns versus rows.
You must submit an excel file not a pdf of the file - I need to be able to click on the cells and see the formula. The file will have two sheets, the first sheet is all the data you enter (and shows use of the SumProduct and VLookup formulas), and the second sheet is the pivot table (though you can submit multiple pivot tables).
Upload the file and the answers to the two questions above.
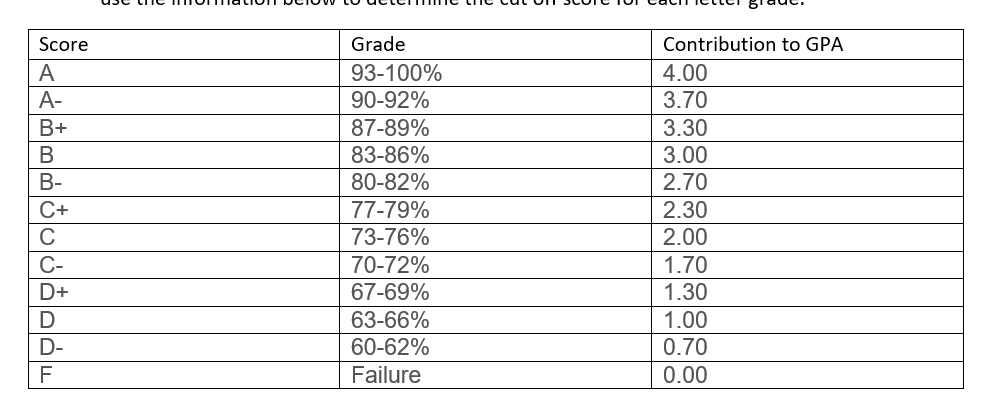
Use the grade chart and the student information below to create your Excel file. Be sure to compare the chart below to the one in my video example; the information being used is different and you need to use the data below.
HINTS:
- Include plus and minus grades.
- The order in which the grades are listed in your grade table (look at the video) is important.
- The grade table in my video does not show a range (e.g. 90-92%) but rather a cut-off score only, and this is very important when creating your grade table. You must use a cut off score also and use the information below to determine the cut off score for each letter grade.
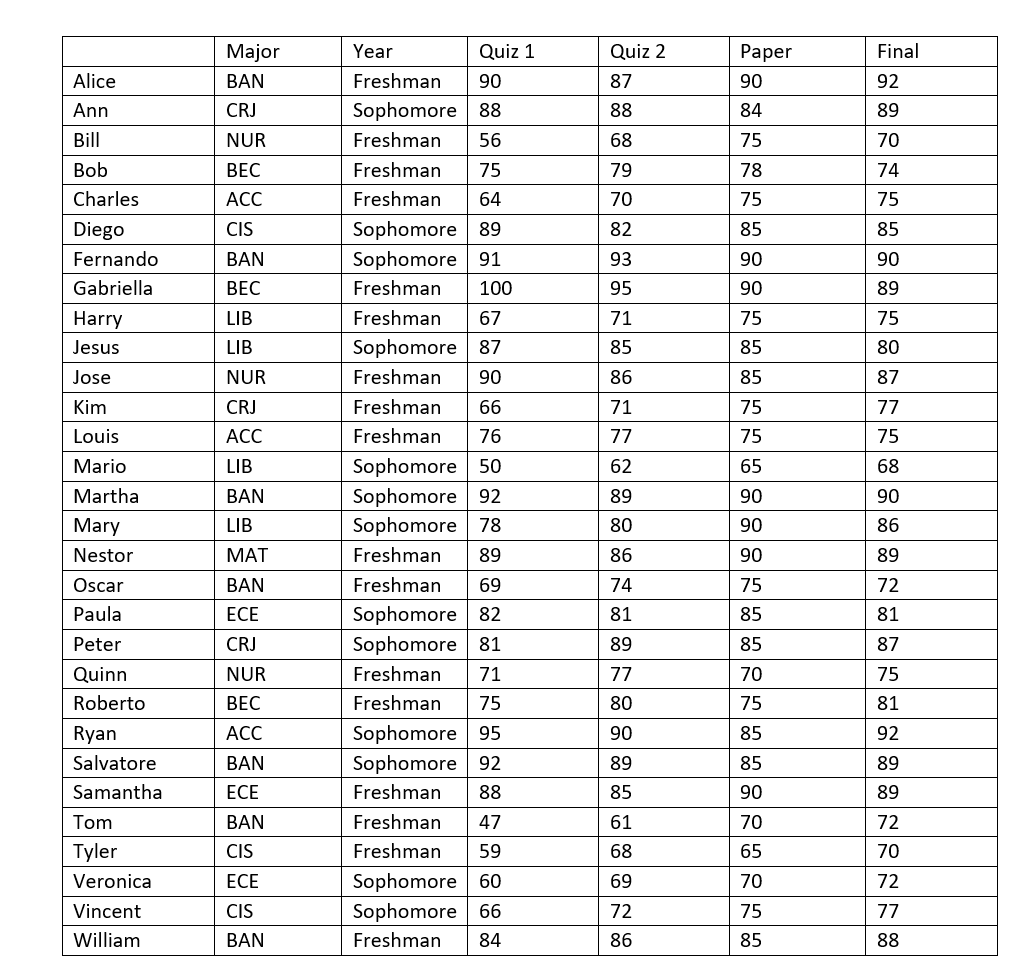
The students and their grades are listed below. The quizzes are worth 10% each, and the paper and the finals are worth 40% each. You cannot simply average the grades because the different components (quizzes, final) have different values.
Step by Step Solution
There are 3 Steps involved in it

Get step-by-step solutions from verified subject matter experts