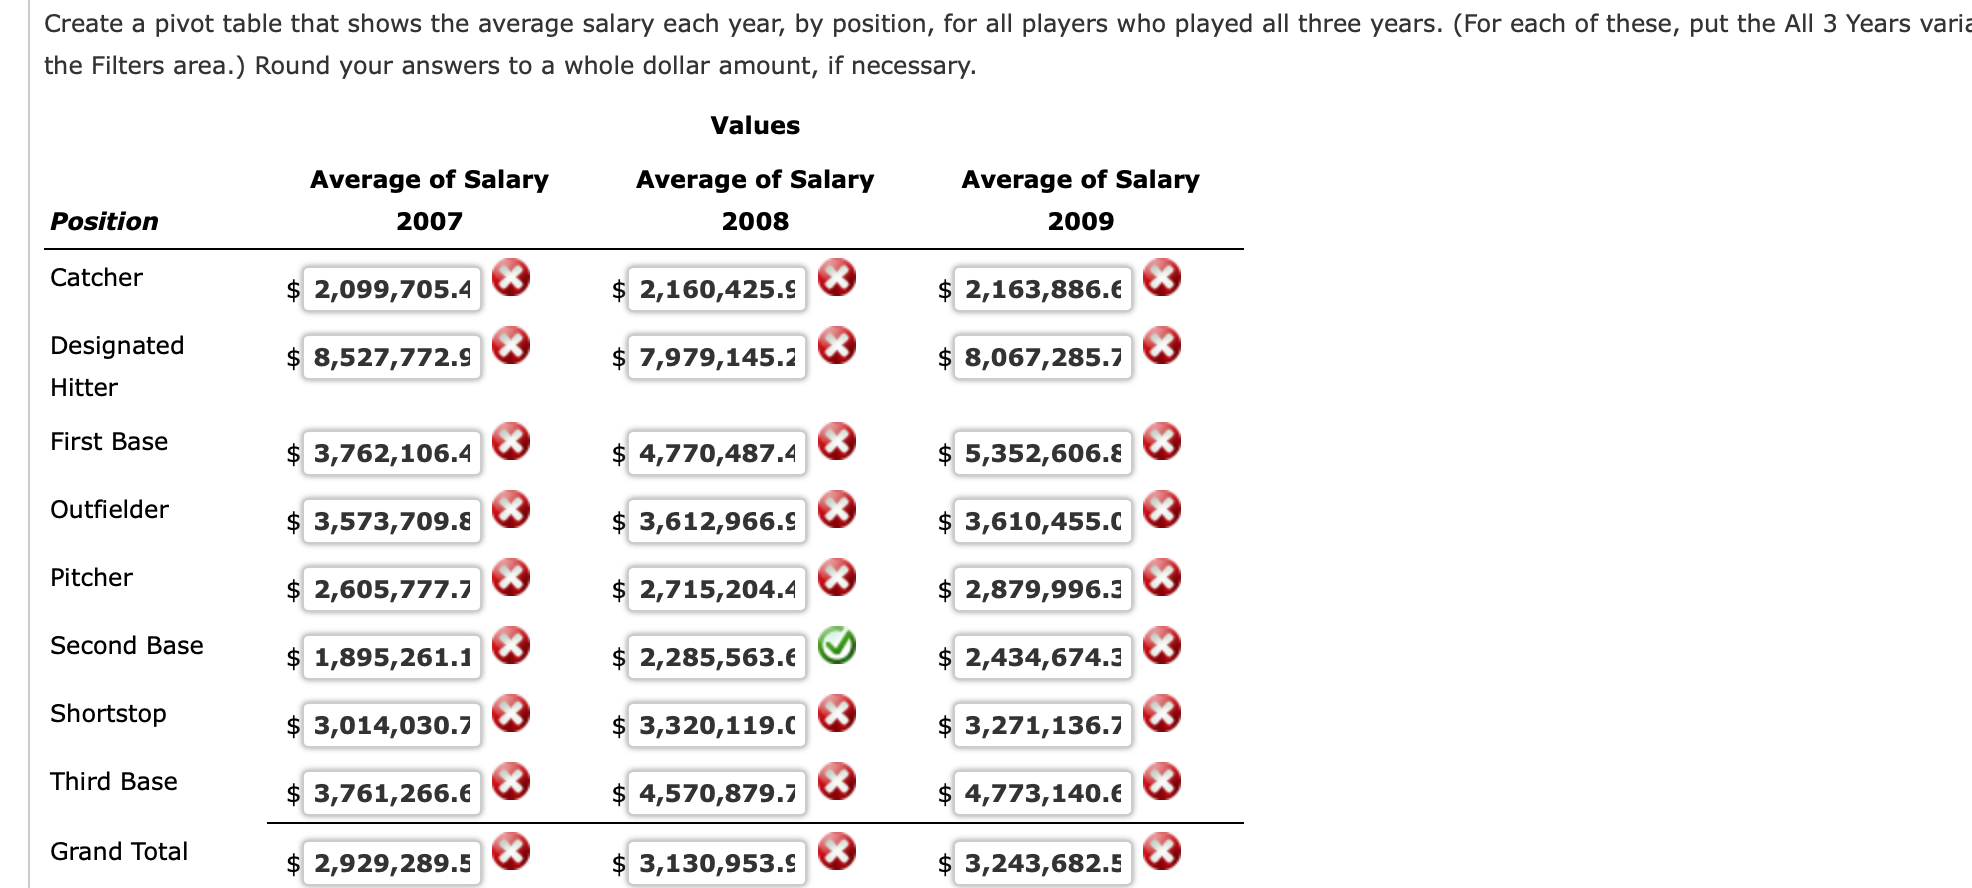
Question: Create a pivot table that shows the average salary each year, by position, for all players who played all three years. (For each of these,
Create a pivot table that shows the average salary each year, by position, for all players who played all three years. (For each of these, put the All 3 Years variz the Filters area.) Round your answers to a whole dollar amount, if necessary. Values Average of Salary Average of Salary Average of Salary Position 2007 2008 2009 Catcher $ 2,099,705.4 @ $ 2,160,425.c| @ $ 2,163,886.c @ Designated $ 8,527,772.9 0 $ 7,979,145.2 Q $ 8,067,285.7 0 Hitter First Base $ 3,762,106.4 Q $ 4,770,487.4 Q $ 5,352,606. Q Outfielder $ 3,573,709.8 @ $ 3,612,966.c @ 3,610,455.c @ Pitcher $ 2,605,777.7 0 $ 2,715,204.4 0 $ 2,879,996.3 0 Second Base $ 1,895,261.1 0 $ 2,285,563. V $ 2,434,674.3 0 Shortstop $ 3,014,030.7 O $ 3,320,119.C 0 $ 3,271,136.7 0 Third Base $ 3,761,266.6 @ $ 4,570,879.7 @ $ 4,773,140. @ Grand Total $ 2,929,289.5 @ $ 3,130,953 & s 3,243,682.5| @
Step by Step Solution
There are 3 Steps involved in it
1 Expert Approved Answer
Step: 1 Unlock
Question Has Been Solved by an Expert!
Get step-by-step solutions from verified subject matter experts
Step: 2 Unlock
Step: 3 Unlock
Students Have Also Explored These Related Mathematics Questions!