

Question: Create a PivotTable using the data in the Sector Data worksheet. The PivotTable must appear in a separate worksheet. Construct the PivotTable as follows: Year
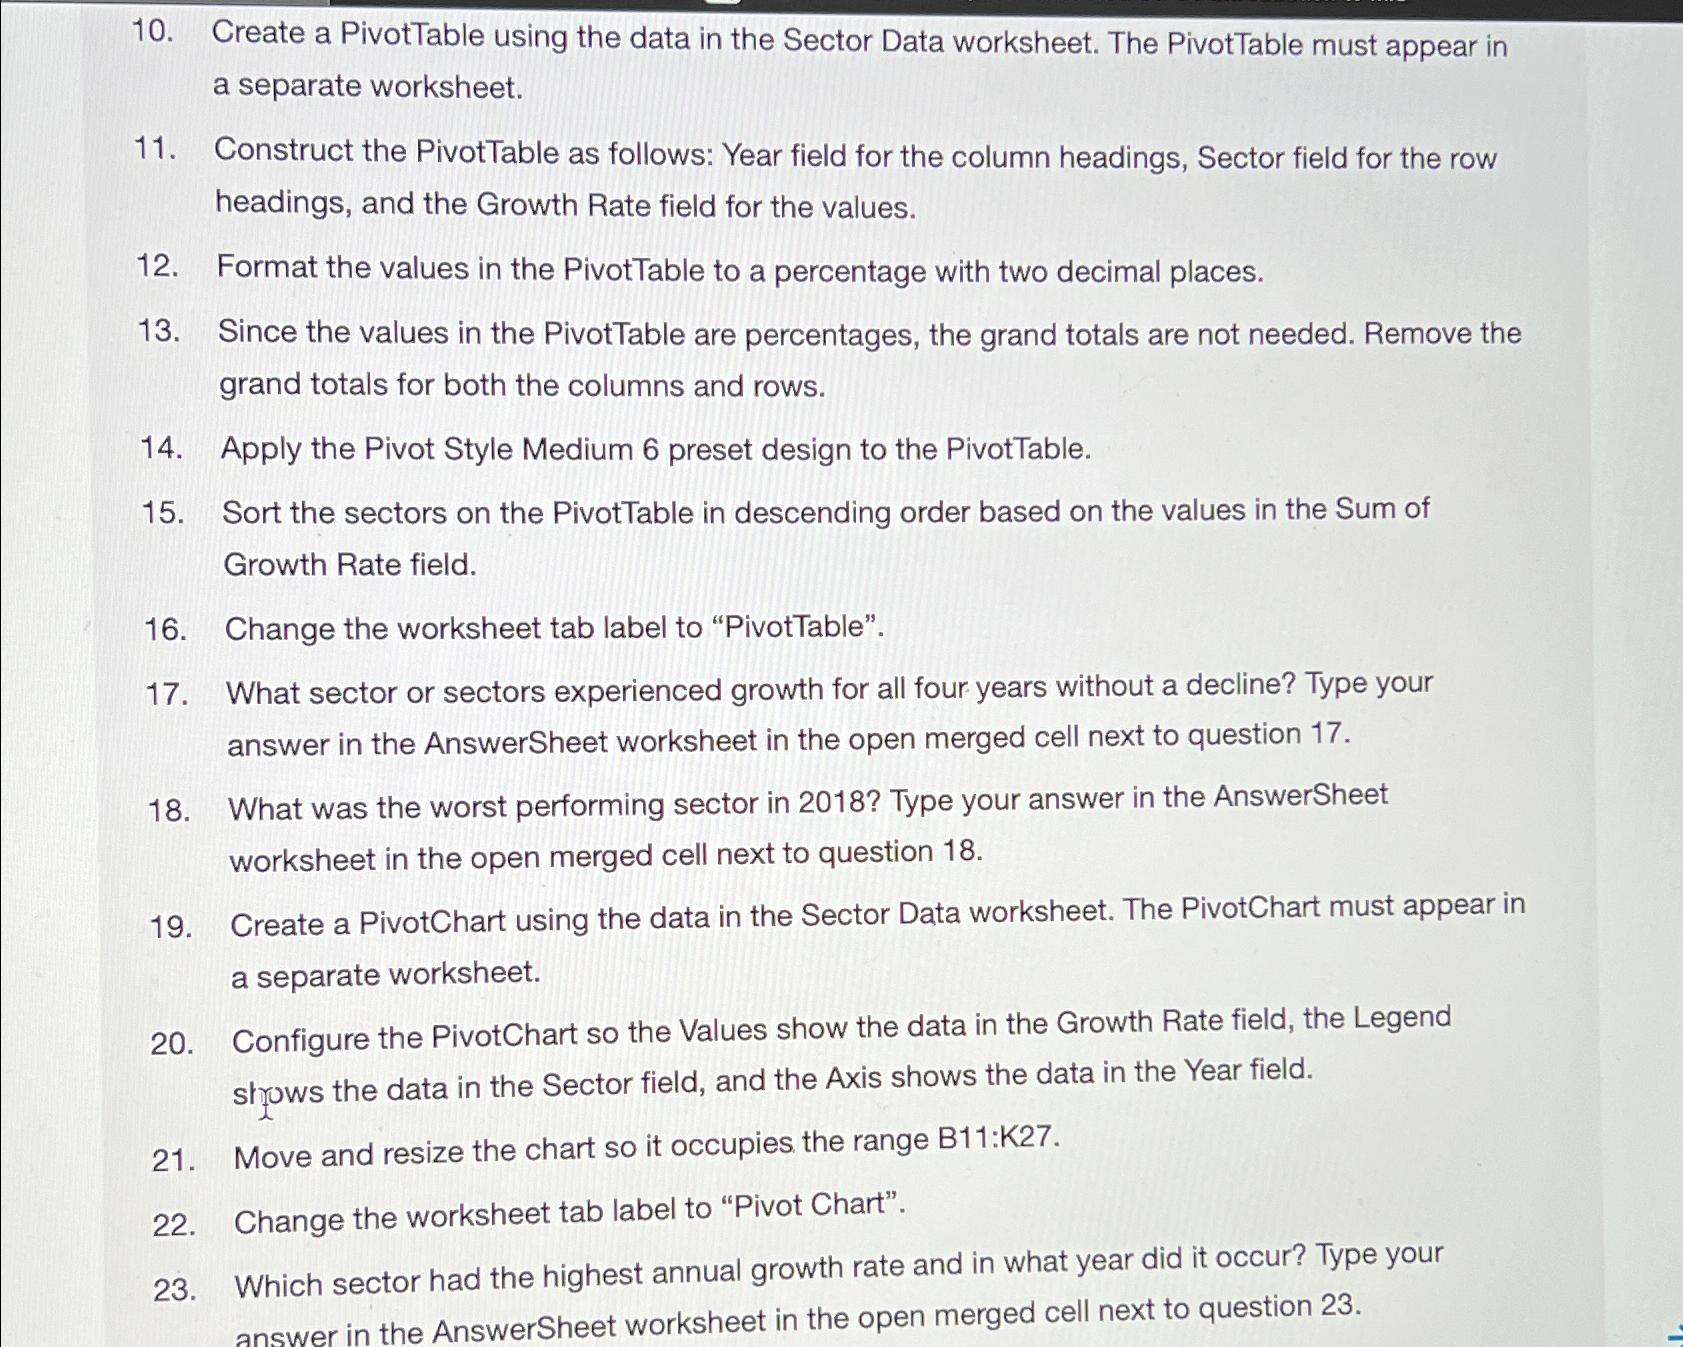
Create a PivotTable using the data in the Sector Data worksheet. The PivotTable must appear in a separate worksheet.
Construct the PivotTable as follows: Year field for the column headings, Sector field for the row headings, and the Growth Rate field for the values.
Format the values in the PivotTable to a percentage with two decimal places.
Since the values in the PivotTable are percentages, the grand totals are not needed. Remove the grand totals for both the columns and rows.
Apply the Pivot Style Medium preset design to the PivotTable.
Sort the sectors on the PivotTable in descending order based on the values in the Sum of Growth Rate field.
Change the worksheet tab label to "PivotTable".
What sector or sectors experienced growth for all four years without a decline? Type your answer in the AnswerSheet worksheet in the open merged cell next to question
What was the worst performing sector in Type your answer in the AnswerSheet worksheet in the open merged cell next to question
Create a PivotChart using the data in the Sector Data worksheet. The PivotChart must appear in a separate worksheet.
Configure the PivotChart so the Values show the data in the Growth Rate field, the Legend shyows the data in the Sector field, and the Axis shows the data in the Year field.
Move and resize the chart so it occupies the range :
Change the worksheet tab label to "Pivot Chart".
Which sector had the highest annual growth rate and in what year did it occur? Type your answer in the AnswerSheet worksheet in the open merged cell next to question
Step by Step Solution
There are 3 Steps involved in it
1 Expert Approved Answer
Step: 1 Unlock

Question Has Been Solved by an Expert!
Get step-by-step solutions from verified subject matter experts
Step: 2 Unlock
Step: 3 Unlock