

Question: %Create a row vector named t containing the values from -2.0 to 10.0 with an increment of 0.25. t=0 %Evaluate f(t) using the formula given
%Create a row vector named t containing the values from -2.0 to 10.0 with an increment of 0.25.
t=0
%Evaluate f(t) using the formula given for the values in the variable t, Only use element by element operations where needed.
f= 0
%plot the formula f for the values in the variable t. Annotate your plot with labels, title and turn on the grid
%Determine the first location (index, only the first zero) where the value of the function is zero. Use a MATLAB comparison to determine the location of the zero value rather than identify the location from the plot.
idx_0_of_F=0
firstZeroIdx=0
%Determine the location (indices) where the value of the function f(t) is greater than or equal to zero.
indices_ge_0 = 0
%Determine the t range where the value of the function f(t) is greater than or equal to zero.
tRange_f_ge_0 = 0
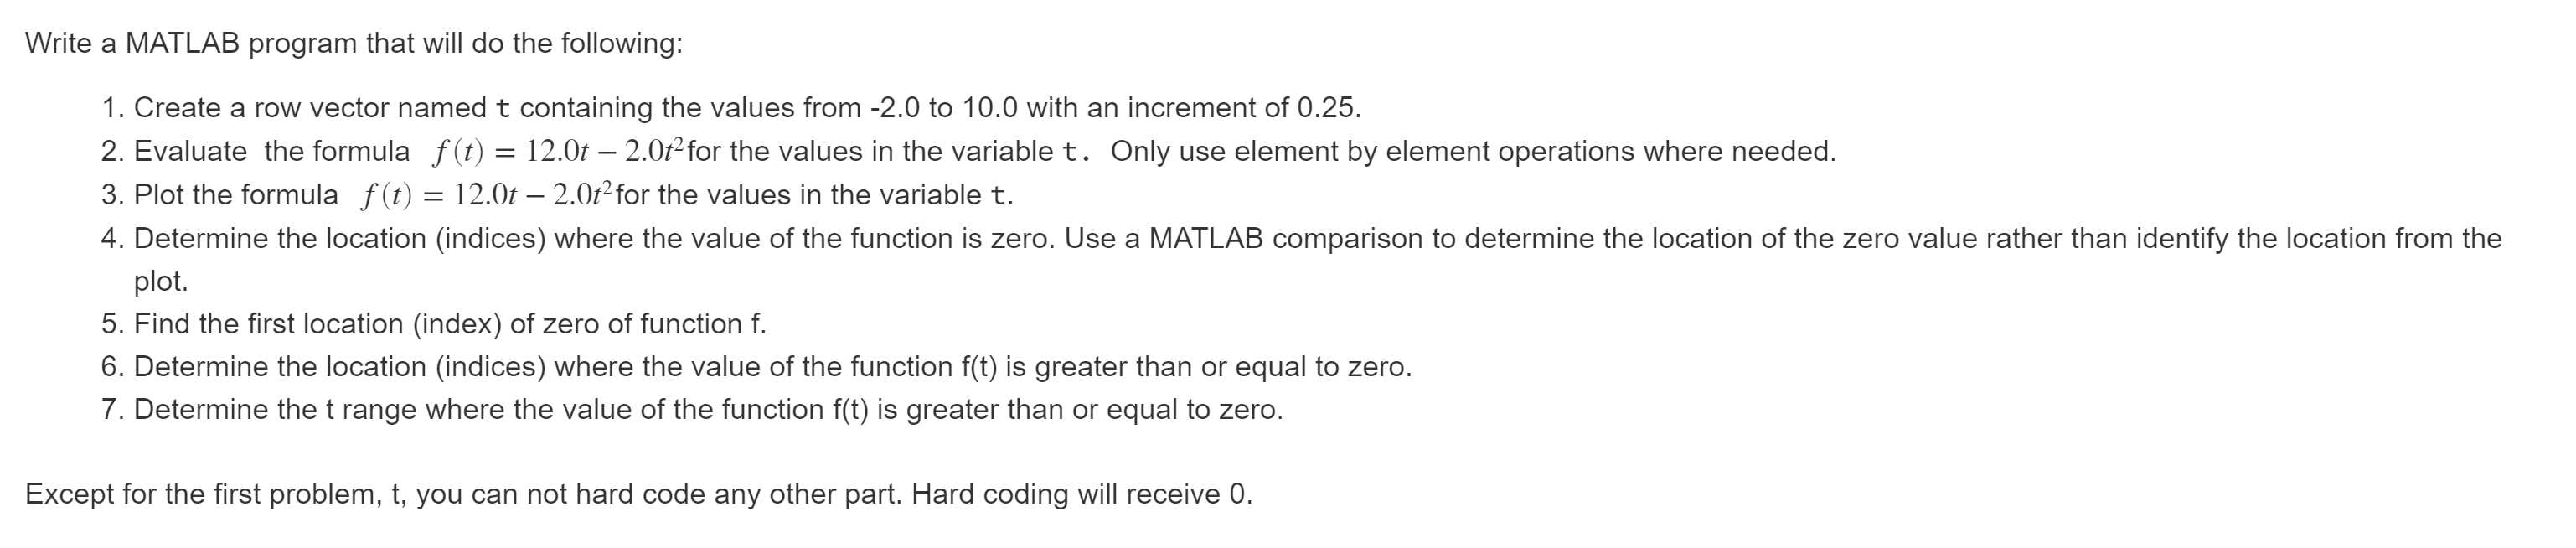
Write a MATLAB program that will do the following: 1. Create a row vector named t containing the values from -2.0 to 10.0 with an increment of 0.25. 2. Evaluate the formula f(t) = 12.0t 2.0tfor the values in the variable t. Only use element by element operations where needed. 3. Plot the formula f(t) = 12.0t 2.0t-for the values in the variable t. 4. Determine the location (indices) where the value of the function is zero. Use a MATLAB comparison to determine the location of the zero value rather than identify the location from the plot. 5. Find the first location (index) of zero of function f. 6. Determine the location (indices) where the value of the function f(t) is greater than or equal to zero. 7. Determine the t range where the value of the function f(t) is greater than or equal to zero. Except for the first problem, t, you can not hard code any other part. Hard coding will receive 0. Write a MATLAB program that will do the following: 1. Create a row vector named t containing the values from -2.0 to 10.0 with an increment of 0.25. 2. Evaluate the formula f(t) = 12.0t 2.0tfor the values in the variable t. Only use element by element operations where needed. 3. Plot the formula f(t) = 12.0t 2.0t-for the values in the variable t. 4. Determine the location (indices) where the value of the function is zero. Use a MATLAB comparison to determine the location of the zero value rather than identify the location from the plot. 5. Find the first location (index) of zero of function f. 6. Determine the location (indices) where the value of the function f(t) is greater than or equal to zero. 7. Determine the t range where the value of the function f(t) is greater than or equal to zero. Except for the first problem, t, you can not hard code any other part. Hard coding will receive 0
Step by Step Solution
There are 3 Steps involved in it

Get step-by-step solutions from verified subject matter experts