

Question: Create a scatter plot with a trend line to show the relationship between disposable income and life insurance coverage. Reach your conclusion about the two
Create a scatter plot with a trend line to show the relationship between disposable income and life insurance coverage. Reach your conclusion about the two variables.
Show the Steps of how you made the graph on excel. And how you edited the graph. 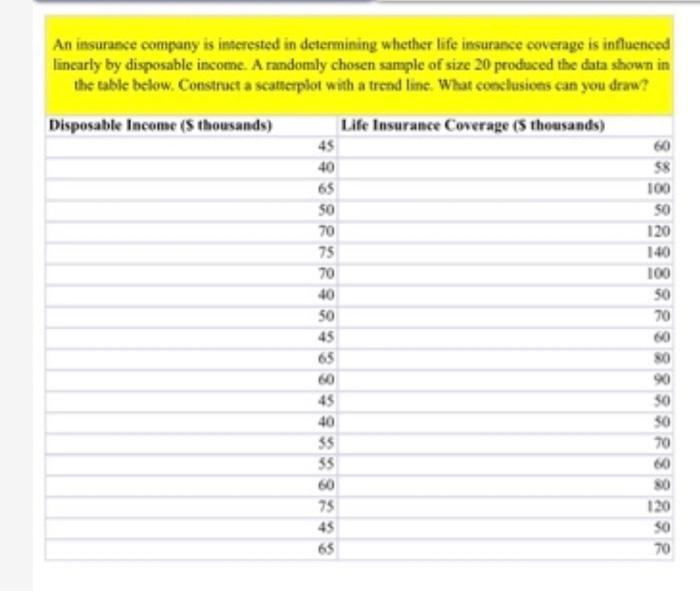
Step by Step Solution
There are 3 Steps involved in it
1 Expert Approved Answer
Step: 1 Unlock

Question Has Been Solved by an Expert!
Get step-by-step solutions from verified subject matter experts
Step: 2 Unlock
Step: 3 Unlock