

Question: Create a script called pyramid.m that plots a function y(x) which is zero for X=1. Plot it using 150 points and a range from -2
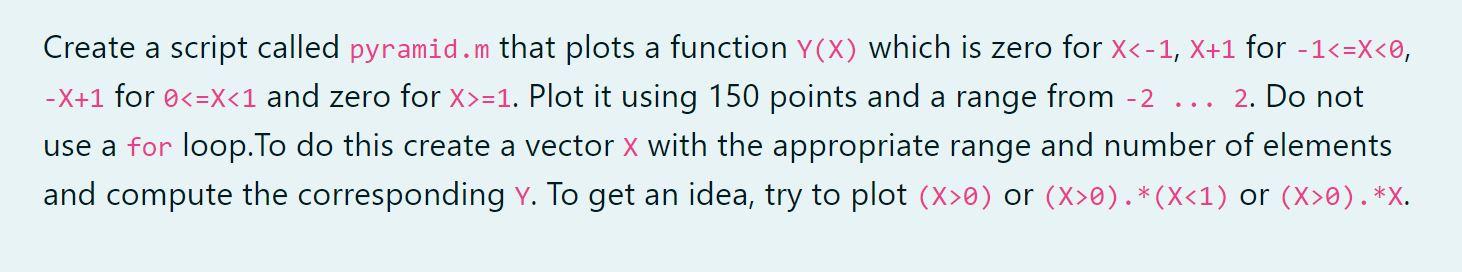
Create a script called pyramid.m that plots a function y(x) which is zero for X=1. Plot it using 150 points and a range from -2 2. Do not use a for loop. To do this create a vector x with the appropriate range and number of elements and compute the corresponding y. To get an idea, try to plot (X>0) or (X>0). *(X0). *X
Step by Step Solution
There are 3 Steps involved in it
1 Expert Approved Answer
Step: 1 Unlock

Question Has Been Solved by an Expert!
Get step-by-step solutions from verified subject matter experts
Step: 2 Unlock
Step: 3 Unlock