Question: Your program must be called my_harter_heighway.py. (3 pts) Your program must define a class called vertex that represents a point in 2D space as an
Your program must be called my_harter_heighway.py.
(3 pts) Your program must define a class called vertex that represents a point in 2D space as an object with the following specifications: (a) (1 pt) Your class must have instance attributes x and y that hold the x and y coordinates of a point, respectively. The __init__() constructor must accept x and y values as two keyword parameters to create an object instance; their default values are both 0. 2 (b) (2 pt) Your class must define a method called next_gen that generates a new instance from two parents, self and other. This method must have an optional keyword argument direction with default value 1. (We will use the convention that 1 encodes left and -1 encodes right, so that swapping direction is simply multiplying by -1.) You must figure out how to compute the x and y position of a new point given two parent points and a direction; this is a geometric exercise.
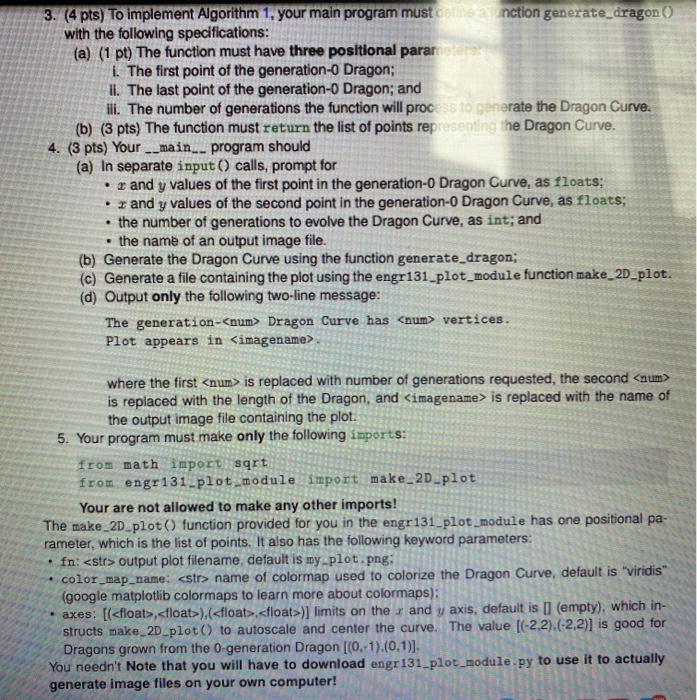
(4 pts) To implement Algorithm 1, your main program must define a function generate_dragon() with the following specifications: (a) (1 pt) The function must have three positional parameters: i. The first point of the generation-0 Dragon; ii. The last point of the generation-0 Dragon; and iii. The number of generations the function will process to generate the Dragon Curve. (b) (3 pts) The function must return the list of points representing the Dragon Curve.
(3 pts) Your __main__ program should (a) In separate input() calls, prompt for x and y values of the first point in the generation-0 Dragon Curve, as floats; x and y values of the second point in the generation-0 Dragon Curve, as floats; the number of generations to evolve the Dragon Curve, as int; and the name of an output image file. (b) Generate the Dragon Curve using the function generate_dragon; (c) Generate a file containing the plot using the engr131_plot_module function make_2D_plot. (d) Output only the following two-line message: The generation- Dragon Curve has vertices. Plot appears in . where the first is replaced with number of generations requested, the second is replaced with the length of the Dragon, and is replaced with the name of the output image file containing the plot.
Your program must make only the following imports: from math import sqrt from engr131_plot_module import make_2D_plot Your are not allowed to make any other imports! The make_2D_plot() function provided for you in the engr131_plot_module has one positional parameter, which is the list of points. It also has the following keyword parameters: fn: output plot filename, default is my_plot.png; color_map_name: name of colormap used to colorize the Dragon Curve, default is viridis (google matplotlib colormaps to learn more about colormaps); axes: [(,),(,)] limits on the x and y axis, default is [] (empty), which instructs make_2D_plot() to autoscale and center the curve. The value [(-2,2),(-2,2)] is good for Dragons grown from the 0-generation Dragon [(0,-1),(0,1)]
. Use a font size no bigger than 12pt and no smaller than 11pt. 2. Use 1-in. margins. 3 3. There is no length requirement or restriction. 4. You must explain how you implemented the point-generation algorithm. 5. You must explain how you implemented Algorithm 1. 6. You must embed figures showing four representative generations of Dragon Curves, with one of them being a generation-14 Dragon Curve. 7. The report should include your name, lecture section, and lab section near the top. 8. The filename of your report should be of the format: --Programming-Assignment-2.pdf
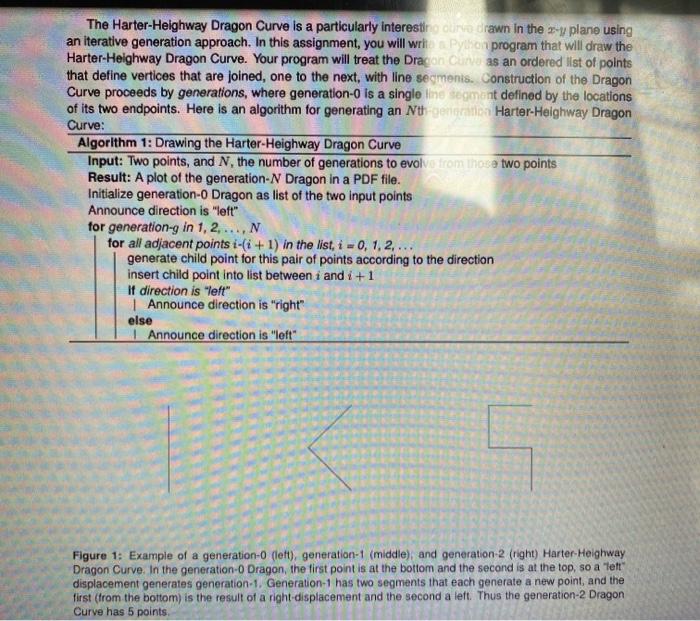
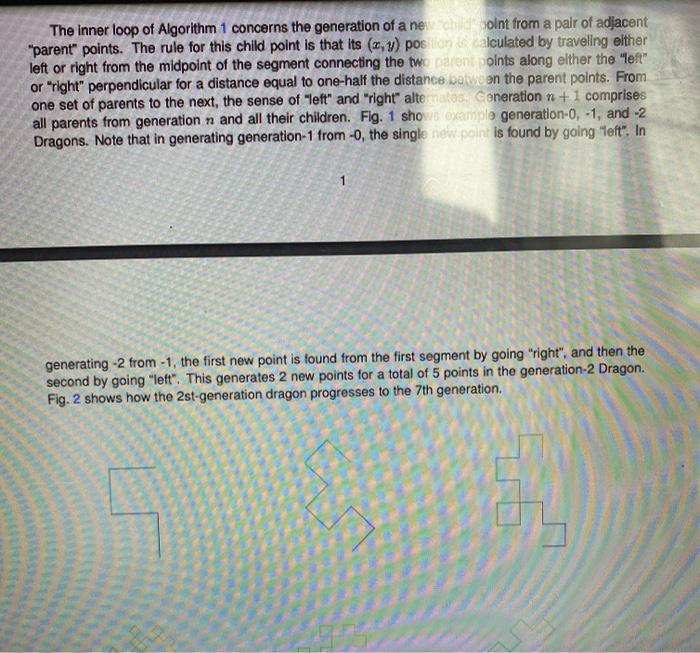
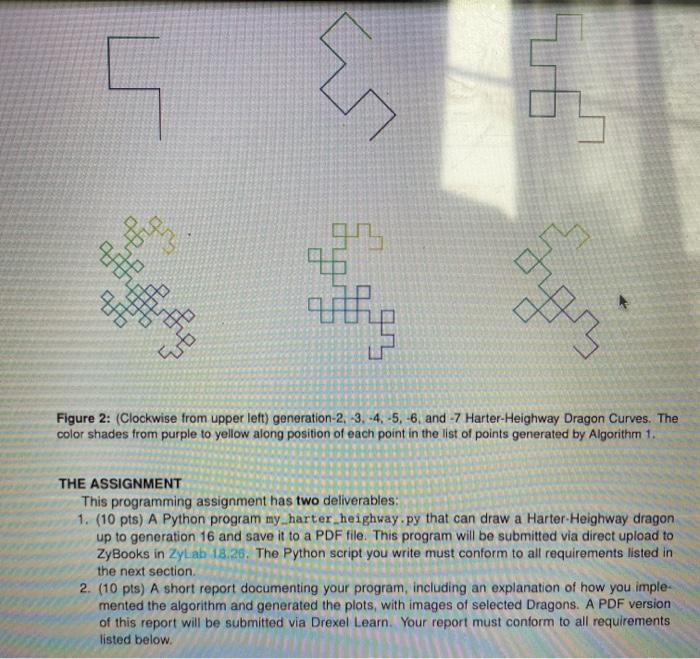
The Harter-Heighway Dragon Curve is a particularly interestino curto drawn in the - plane using an iterative generation approach. In this assignment, you will writes Python program that will draw the Harter-Helghway Dragon Curve. Your program will treat the Dragon Cunu as an ordered list of points that define vertices that are joined, one to the next, with line segments. Construction of the Dragon Curve proceeds by generations, where generation-0 is a single line segment defined by the locations of its two endpoints. Here is an algorithm for generating an Ngen Harter-Heighway Dragon Curve: Algorithm 1: Drawing the Harter-Heighway Dragon Curve Input: Two points, and N, the number of generations to evolve from those two points Result: A plot of the generation-N Dragon in a PDF file. Initialize generation-0 Dragon as list of the two input points Announce direction is "left" for generation-g in 1, 2, ...,N for all adjacent points i-(i + 1) in the list, i = 0, 1, 2, ... generate child point for this pair of points according to the direction insert child point into list between i and i +1 It direction is "left" Announce direction is "right" else | Announce direction is "left" Figure 1: Example of a generation-0 (left), generation-1 (middle), and generation 2 (right) Harter-Heighway Dragon Curve. In the generation-0 Dragon, the first point is at the bottom and the second is at the top, so a Teft" displacement generates generation 1. Generation-1 has two segments that each generate a new point, and the first (trom the bottom) is the result of a right-displacement and the second a lett. Thus the generation 2 Dragon Curve has 5 points The Inner loop of Algorithm 1 concerns the generation of a new chloint from a pair of adjacent "parent" points. The rule for this child point is that its (x, y) pos on alculated by traveling elther left or right from the midpoint of the segment connecting the two arent oints along elther the "left" or "right" perpendicular for a distance equal to one-half the distance been the parent points. From one set of parents to the next, the sense of "left" and "right" altekos Ceneration n + 1 comprises all parents from generation n and all their children. Fig. 1 show example generation-0, -1, and -2 Dragons. Note that in generating generation-1 from -o, the single new.point is found by going "left". In generating -2 from - 1, the first new point is found from the first segment by going "right", and then the second by going "left". This generates 2 new points for a total of 5 points in the generation 2 Dragon. Fig. 2 shows how the 2st-generation dragon progresses to the 7th generation. UT q ug with ta Figure 2: (Clockwise from upper left) generation-2, -3.-4.-5, -6, and -7 Harter-Heighway Dragon Curves. The color Shades from purple to yellow along position of each point in the list of points generated by Algorithm 1. THE ASSIGNMENT This programming assignment has two deliverables: 1. (10 pts) A Python program my harter heighway.py that can draw a Harter-Heighway dragon up to generation 16 and save it to a PDF file. This program will be submitted via direct upload to ZyBooks in ZyLab 18.25. The Python script you write must conform to all requirements listed in the next section. 2. (10 pts) A short report documenting your program, including an explanation of how you imple- mented the algorithm and generated the plots, with images of selected Dragons. A PDF version of this report will be submitted via Drexel Learn. Your report must conform to all requirements listed below THE ASSIGNMENT This programming assignment has two deliverables: 1. (10 pts) A Python program my_harter_heighway.py that can draw a Harter-Helghway dragon up to generation 16 and save it to a PDF file. This program be submitted via direct upload to ZyBooks in ZyLab 18.26. The Python script you write mus conform to all requirements listed in the next section. 2. (10 pts) A short report documenting your program, including an ex anation of how you imple- mented the algorithm and generated the plots, with images of selected Dragons. A PDF version of this report will be submitted via Drexel Learn. Your report must conform to all requirements listed below. PYTHON PROGRAM REQUIREMENTS 1. Your program must be called my_harter_heighway.py. 2. (3 pts) Your program must define a class called vertex that represents a point in 2D space as an object with the following specifications: (a) (1 pt) Your class must have instance attributes x and y that hold the r and y coordinates of a point, respectively. The __init__() constructor must accept r and y values as two keyword parameters to create an object instance; their default values are both 0. 2 (b) (2 pt) Your class must define a method called next gen that generates a new instance from two "parents", self and other. This method must have an optional keyword argument direction with default value 1. (We will use the convention that 1 encodes "left" and -1 encodes "right", so that swapping direction is simply multiplying by 1.) You must figure out how to compute the x and y position of a new point given two parent points and a direction: this is a geometric exercise. 3. (4 pts) To implement Algorithm 1. your main program must define a function generate_dragon with the followinn enorifiratinne 3. (4 pts) To implement Algorithm 1, your main program must onenction generate_dragon with the following specifications: (a) (1 pt) The function must have three positional parameters 1. The first point of the generation-0 Dragon; II. The last point of the generation-0 Dragon; and ill. The number of generations the function will process to generate the Dragon Curve. (b) (3 pts) The function must return the list of points representing the Dragon Curve. 4. (3 pts) Your -_main_- program should (a) In separate input() calls, prompt for r and y values of the first point in the generation-0 Dragon Curve, as floats; rand y values of the second point in the generation-0 Dragon Curve, as floats; the number of generations to evolve the Dragon Curve, as int; and the name of an output image file. (b) Generate the Dragon Curve using the function generate_dragon; (c) Generate a file containing the plot using the engr131_plot_module function make_2D-plot. (d) Output only the following two-line message: The generation- Dragon Curve has vertices. Plot appears in . where the first is replaced with number of generations requested, the second is replaced with the length of the Dragon, and is replaced with the name of the output image file containing the plot. 5. Your program must make only the following imports: from math import sort from engr131-plot_module import make_2D-plot Your are not allowed to make any other imports! The make_2D_plot() function provided for you in the engr131_plot_module has one positional pa- rameter, which is the list of points. It also has the following keyword parameters: . fn: output plot filename, default is my-plot.png color_map_name: name of colormap used to colorize the Dragon Curve, default is "viridis (google matplotlib colormaps to learn more about colormaps): axes: [(,),( ] limits on the x and y axis, default is [ (empty), which in- structs make_2D_plot() to autoscale and center the curve. The value [(-2.2).(-2.2)] is good for Dragons grown from the 0-generation Dragon [(0, 1).(0.1)). You needn't Note that you will have to download engr131_plot_module.py to use it to actually generate image files on your own computer! from engr131_plot_module import make 2D Your are not allowed to make any other Imports! The make_2D_plot() function provided for you in the engr13110module has one positional pa- rameter, which is the list of points. It also has the following keyword parameters: fn: output plot filename, default is my-plot.png: color_map_name: name of colormap used to colorize the Dragon Curve, default is "viridis" (google matplotlib colormaps to learn more about colormaps) axes: [(, ),(, )] limits on the r and als de ault is I (empty), which in structs make_20_plot() to autoscale and center the curve. The valde [(-2,2).(-2,2)) is good for Dragons grown from the O-generation Dragon [(0,-1),(0,1)). You needn't Note that you will have to download engr 131_plot_module.py to use it to actually generate Image files on your own computer! REPORT REQUIREMENTS 1. Use a font size no bigger than 12pt and no smaller than 11pt. 2. Use 1-in, margins. 3 3. There is no length requirement or restriction 4. You must explain how you implemented the point-generation algorithm. 5. You must explain how you implemented Algorithm 1. 6. You must embed figures showing four representative generations of Dragon Curves, with one of them being a generation-14 Dragon Curve. 7. The report should include your name, lecture section, and lab section near the top. 8. The filename of your report should be of the format: --Programming Assignment-2.pdf The Harter-Heighway Dragon Curve is a particularly interestino curto drawn in the - plane using an iterative generation approach. In this assignment, you will writes Python program that will draw the Harter-Helghway Dragon Curve. Your program will treat the Dragon Cunu as an ordered list of points that define vertices that are joined, one to the next, with line segments. Construction of the Dragon Curve proceeds by generations, where generation-0 is a single line segment defined by the locations of its two endpoints. Here is an algorithm for generating an Ngen Harter-Heighway Dragon Curve: Algorithm 1: Drawing the Harter-Heighway Dragon Curve Input: Two points, and N, the number of generations to evolve from those two points Result: A plot of the generation-N Dragon in a PDF file. Initialize generation-0 Dragon as list of the two input points Announce direction is "left" for generation-g in 1, 2, ...,N for all adjacent points i-(i + 1) in the list, i = 0, 1, 2, ... generate child point for this pair of points according to the direction insert child point into list between i and i +1 It direction is "left" Announce direction is "right" else | Announce direction is "left" Figure 1: Example of a generation-0 (left), generation-1 (middle), and generation 2 (right) Harter-Heighway Dragon Curve. In the generation-0 Dragon, the first point is at the bottom and the second is at the top, so a Teft" displacement generates generation 1. Generation-1 has two segments that each generate a new point, and the first (trom the bottom) is the result of a right-displacement and the second a lett. Thus the generation 2 Dragon Curve has 5 points The Inner loop of Algorithm 1 concerns the generation of a new chloint from a pair of adjacent "parent" points. The rule for this child point is that its (x, y) pos on alculated by traveling elther left or right from the midpoint of the segment connecting the two arent oints along elther the "left" or "right" perpendicular for a distance equal to one-half the distance been the parent points. From one set of parents to the next, the sense of "left" and "right" altekos Ceneration n + 1 comprises all parents from generation n and all their children. Fig. 1 show example generation-0, -1, and -2 Dragons. Note that in generating generation-1 from -o, the single new.point is found by going "left". In generating -2 from - 1, the first new point is found from the first segment by going "right", and then the second by going "left". This generates 2 new points for a total of 5 points in the generation 2 Dragon. Fig. 2 shows how the 2st-generation dragon progresses to the 7th generation. UT q ug with ta Figure 2: (Clockwise from upper left) generation-2, -3.-4.-5, -6, and -7 Harter-Heighway Dragon Curves. The color Shades from purple to yellow along position of each point in the list of points generated by Algorithm 1. THE ASSIGNMENT This programming assignment has two deliverables: 1. (10 pts) A Python program my harter heighway.py that can draw a Harter-Heighway dragon up to generation 16 and save it to a PDF file. This program will be submitted via direct upload to ZyBooks in ZyLab 18.25. The Python script you write must conform to all requirements listed in the next section. 2. (10 pts) A short report documenting your program, including an explanation of how you imple- mented the algorithm and generated the plots, with images of selected Dragons. A PDF version of this report will be submitted via Drexel Learn. Your report must conform to all requirements listed below THE ASSIGNMENT This programming assignment has two deliverables: 1. (10 pts) A Python program my_harter_heighway.py that can draw a Harter-Helghway dragon up to generation 16 and save it to a PDF file. This program be submitted via direct upload to ZyBooks in ZyLab 18.26. The Python script you write mus conform to all requirements listed in the next section. 2. (10 pts) A short report documenting your program, including an ex anation of how you imple- mented the algorithm and generated the plots, with images of selected Dragons. A PDF version of this report will be submitted via Drexel Learn. Your report must conform to all requirements listed below. PYTHON PROGRAM REQUIREMENTS 1. Your program must be called my_harter_heighway.py. 2. (3 pts) Your program must define a class called vertex that represents a point in 2D space as an object with the following specifications: (a) (1 pt) Your class must have instance attributes x and y that hold the r and y coordinates of a point, respectively. The __init__() constructor must accept r and y values as two keyword parameters to create an object instance; their default values are both 0. 2 (b) (2 pt) Your class must define a method called next gen that generates a new instance from two "parents", self and other. This method must have an optional keyword argument direction with default value 1. (We will use the convention that 1 encodes "left" and -1 encodes "right", so that swapping direction is simply multiplying by 1.) You must figure out how to compute the x and y position of a new point given two parent points and a direction: this is a geometric exercise. 3. (4 pts) To implement Algorithm 1. your main program must define a function generate_dragon with the followinn enorifiratinne 3. (4 pts) To implement Algorithm 1, your main program must onenction generate_dragon with the following specifications: (a) (1 pt) The function must have three positional parameters 1. The first point of the generation-0 Dragon; II. The last point of the generation-0 Dragon; and ill. The number of generations the function will process to generate the Dragon Curve. (b) (3 pts) The function must return the list of points representing the Dragon Curve. 4. (3 pts) Your -_main_- program should (a) In separate input() calls, prompt for r and y values of the first point in the generation-0 Dragon Curve, as floats; rand y values of the second point in the generation-0 Dragon Curve, as floats; the number of generations to evolve the Dragon Curve, as int; and the name of an output image file. (b) Generate the Dragon Curve using the function generate_dragon; (c) Generate a file containing the plot using the engr131_plot_module function make_2D-plot. (d) Output only the following two-line message: The generation- Dragon Curve has vertices. Plot appears in . where the first is replaced with number of generations requested, the second is replaced with the length of the Dragon, and is replaced with the name of the output image file containing the plot. 5. Your program must make only the following imports: from math import sort from engr131-plot_module import make_2D-plot Your are not allowed to make any other imports! The make_2D_plot() function provided for you in the engr131_plot_module has one positional pa- rameter, which is the list of points. It also has the following keyword parameters: . fn: output plot filename, default is my-plot.png color_map_name: name of colormap used to colorize the Dragon Curve, default is "viridis (google matplotlib colormaps to learn more about colormaps): axes: [(,),( ] limits on the x and y axis, default is [ (empty), which in- structs make_2D_plot() to autoscale and center the curve. The value [(-2.2).(-2.2)] is good for Dragons grown from the 0-generation Dragon [(0, 1).(0.1)). You needn't Note that you will have to download engr131_plot_module.py to use it to actually generate image files on your own computer! from engr131_plot_module import make 2D Your are not allowed to make any other Imports! The make_2D_plot() function provided for you in the engr13110module has one positional pa- rameter, which is the list of points. It also has the following keyword parameters: fn: output plot filename, default is my-plot.png: color_map_name: name of colormap used to colorize the Dragon Curve, default is "viridis" (google matplotlib colormaps to learn more about colormaps) axes: [(, ),(, )] limits on the r and als de ault is I (empty), which in structs make_20_plot() to autoscale and center the curve. The valde [(-2,2).(-2,2)) is good for Dragons grown from the O-generation Dragon [(0,-1),(0,1)). You needn't Note that you will have to download engr 131_plot_module.py to use it to actually generate Image files on your own computer! REPORT REQUIREMENTS 1. Use a font size no bigger than 12pt and no smaller than 11pt. 2. Use 1-in, margins. 3 3. There is no length requirement or restriction 4. You must explain how you implemented the point-generation algorithm. 5. You must explain how you implemented Algorithm 1. 6. You must embed figures showing four representative generations of Dragon Curves, with one of them being a generation-14 Dragon Curve. 7. The report should include your name, lecture section, and lab section near the top. 8. The filename of your report should be of the format: --Programming Assignment-2.pdf


