

Question: Create a script in Excel VBA that loops through all the stocks for one year and outputs the following information: -The ticker symbol -Yearly change
Create a script in Excel VBA that loops through all the stocks for one year and outputs the following information:
-The ticker symbol
-Yearly change from the opening price at the beginning of a given year to the closing price at the end of that year.
-The percentage change from the opening price at the beginning of a given year to the closing price at the end of that year.
-The total stock volume of the stock. The result should match the following image: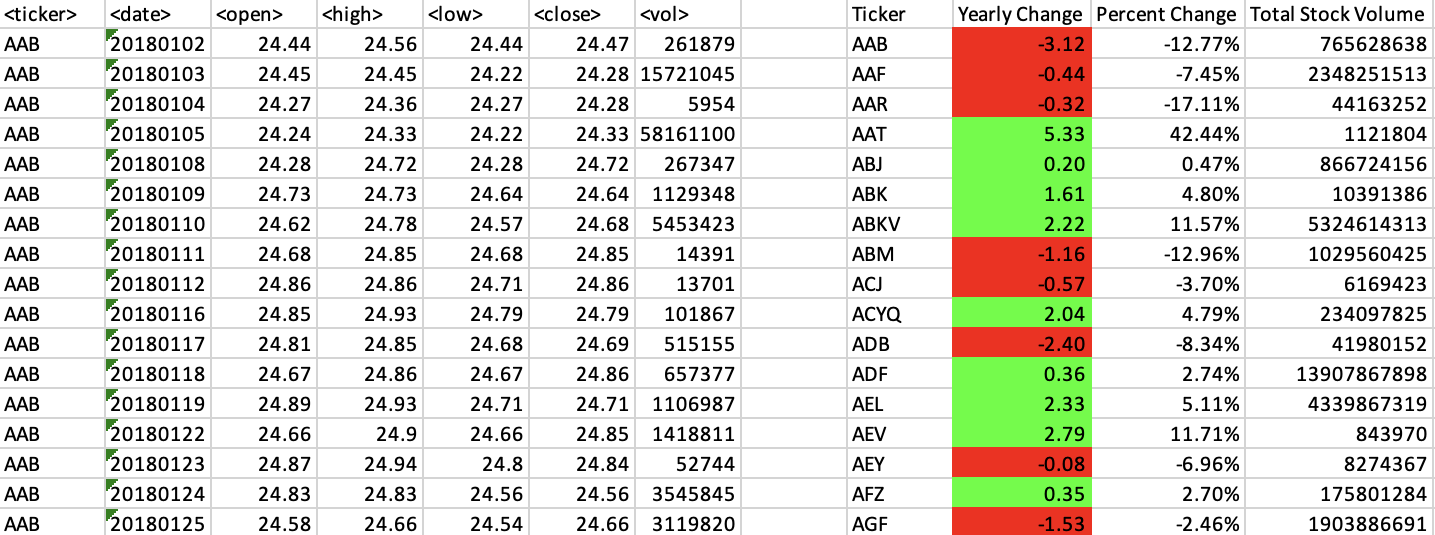
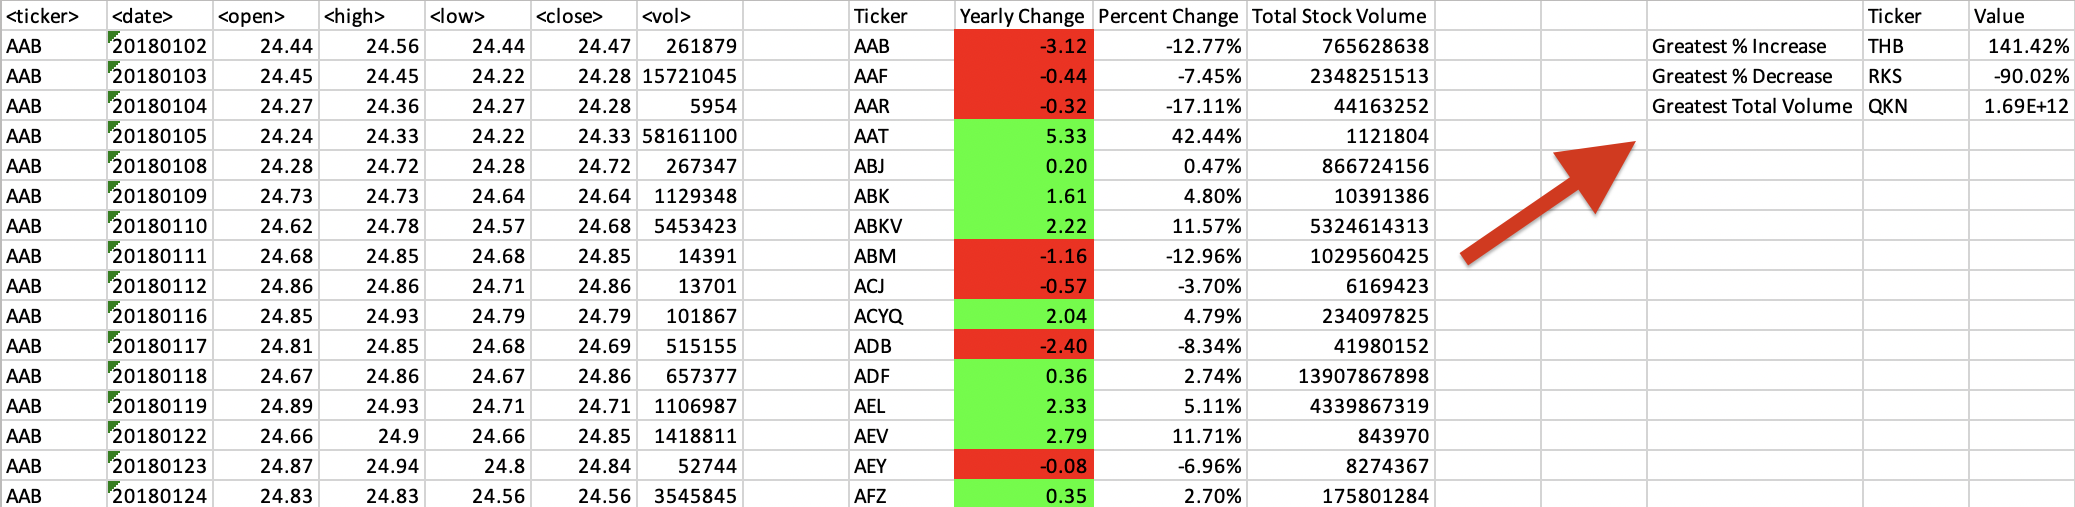
Add functionality to your script to return the stock with the "Greatest % increase", "Greatest % decrease", and "Greatest total volume". The solution should match the following image:
Make the appropriate adjustments to your VBA script to enable it to run on every worksheet (that is, every year) at once.
Here is what I have so far. Returns a For without next
Sub StockAnalysis() ' Loop through all worksheets in the workbook For Each ws In ThisWorkbook.Worksheets ' Set initial variables Dim Ticker As String Dim YearlyChange As Double Dim PercentChange As Double Dim TotalVolume As Double Dim LastRow As Long Dim SummaryRow As Long Dim OpeningPrice As Double Dim ClosingPrice As Double ' Set column headers in summary table ws.Cells(1, 9).Value = "Ticker" ws.Cells(1, 10).Value = "Yearly Change" ws.Cells(1, 11).Value = "Percent Change" ws.Cells(1, 12).Value = "Total Stock Volume" ' Find the last row of data in the worksheet LastRow = ws.Cells(Rows.Count, 1).End(xlUp).Row ' Set initial summary table row SummaryRow = 2 ' Loop through all rows of data For i = 2 To LastRow ' Check if the ticker symbol has changed If ws.Cells(i + 1, 1).Value ws.Cells(i, 1).Value Then ' Get the ticker symbol Ticker = ws.Cells(i, 1).Value ' Get the opening price OpeningPrice = ws.Cells(i, 3).Value ' Get the closing price ClosingPrice = ws.Cells(i, 6).Value ' Calculate the yearly change YearlyChange = ClosingPrice - OpeningPrice ' Calculate the percent change If OpeningPrice 0 Then PercentChange = (YearlyChange / OpeningPrice) * 100 Else PercentChange = 0 End If ' Add the yearly change, percent change, and total volume to the summary table ws.Cells(SummaryRow, 9).Value = Ticker ws.Cells(SummaryRow, 10).Value = YearlyChange ws.Cells(SummaryRow, 11).Value = PercentChange ws.Cells(SummaryRow, 12).Value = Application.WorksheetFunction.Sum(ws.Range(ws.Cells(i - TotalVolume + 1, 7), ws.Cells(i, 7))) ' Format the percent change as a percentage ws.Cells(SummaryRow, 11).NumberFormat = "0.00%" ' Conditional formatting for positive and negative yearly changes If YearlyChange > 0 Then ws.Cells(SummaryRow, 10).Interior.Color = RGB(0, 255, 0) ElseIf YearlyChange
\begin{tabular}{|c|c|c|c|c|c|c|c|c|c|c|} \hline & & & & & & & Ticker & Yearly Change & Percent Change & Total Stock Volume \\ \hline AAB & 20180102 & 24.44 & 24.56 & 24.44 & 24.47 & 261879 & AAB & -3.12 & 12.77% & 765628638 \\ \hline AAB & 20180103 & 24.45 & 24.45 & 24.22 & 24.28 & 15721045 & AAF & -0.44 & 7.45% & 2348251513 \\ \hline AAB & 20180104 & 24.27 & 24.36 & 24.27 & 24.28 & 5954 & AAR & -0.32 & 17.11% & 44163252 \\ \hline AAB & 20180105 & 24.24 & 24.33 & 24.22 & 24.33 & 58161100 & AAT & 5.33 & 42.44% & 1121804 \\ \hline AAB & 20180108 & 24.28 & 24.72 & 24.28 & 24.72 & 267347 & ABJ & 0.20 & 0.47% & 866724156 \\ \hline AAB & 20180109 & 24.73 & 24.73 & 24.64 & 24.64 & 1129348 & ABK & 1.61 & 4.80% & 10391386 \\ \hline AAB & 20180110 & 24.62 & 24.78 & 24.57 & 24.68 & 5453423 & ABKV & 2.22 & 11.57% & 5324614313 \\ \hline AAB & 20180111 & 24.68 & 24.85 & 24.68 & 24.85 & 14391 & ABM & -1.16 & 12.96% & 1029560425 \\ \hline AAB & 20180112 & 24.86 & 24.86 & 24.71 & 24.86 & 13701 & ACJ & -0.57 & 3.70% & 6169423 \\ \hline AAB & 20180116 & 24.85 & 24.93 & 24.79 & 24.79 & 101867 & ACYQ & 2.04 & 4.79% & 234097825 \\ \hline AAB & 20180117 & 24.81 & 24.85 & 24.68 & 24.69 & 515155 & ADB & -2.40 & 8.34% & 41980152 \\ \hline AAB & 20180118 & 24.67 & 24.86 & 24.67 & 24.86 & 657377 & ADF & 0.36 & 2.74% & 13907867898 \\ \hline AAB & 20180119 & 24.89 & 24.93 & 24.71 & 24.71 & 1106987 & AEL & 2.33 & 5.11% & 4339867319 \\ \hline AAB & 20180122 & 24.66 & 24.9 & 24.66 & 24.85 & 1418811 & AEV & 2.79 & 11.71% & 843970 \\ \hline AAB & 20180123 & 24.87 & 24.94 & 24.8 & 24.84 & 52744 & AEY & -0.08 & 6.96% & 8274367 \\ \hline AAB & 20180124 & 24.83 & 24.83 & 24.56 & 24.56 & 3545845 & AFZ & 0.35 & 2.70% & 175801284 \\ \hline AAB & 20180125 & 24.58 & 24.66 & 24.54 & 24.66 & 3119820 & AGF & -1.53 & 2.46% & 1903886691 \\ \hline \end{tabular}
Step by Step Solution
There are 3 Steps involved in it

Get step-by-step solutions from verified subject matter experts