

Question: Create a script in Excel VBA that loops through all the stocks for one year and outputs the following information: -The ticker symbol -Yearly change
Create a script in Excel VBA that loops through all the stocks for one year and outputs the following information:
-The ticker symbol
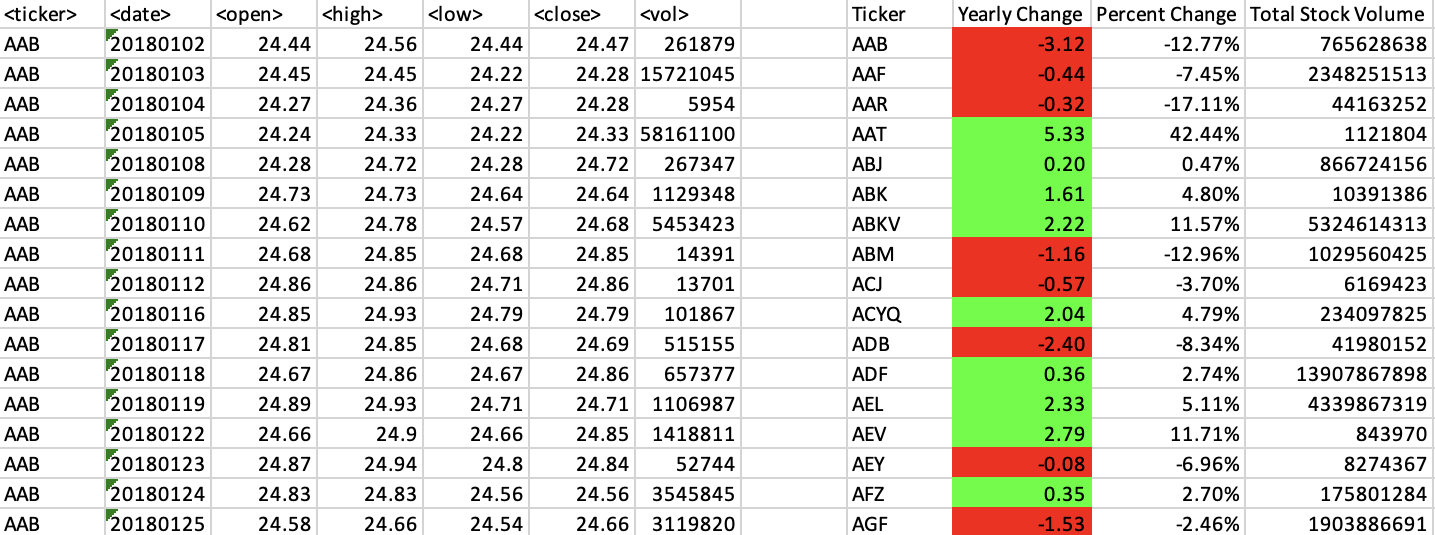
-Yearly change from the opening price at the beginning of a given year to the closing price at the end of that year.
-The percentage change from the opening price at the beginning of a given year to the closing price at the end of that year.
-The total stock volume of the stock. The result should match the following image:
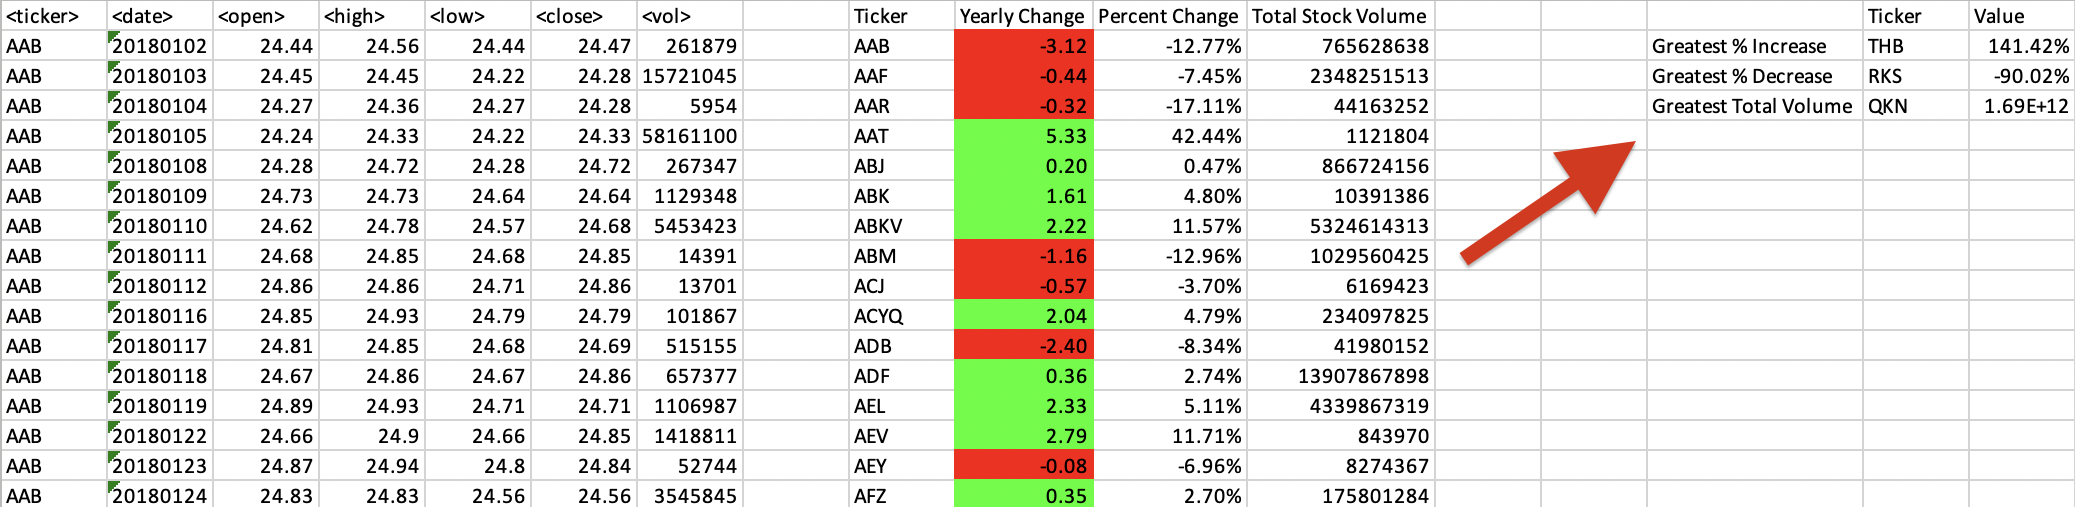
Add functionality to your script to return the stock with the "Greatest % increase", "Greatest % decrease", and "Greatest total volume". The solution should match the following image:
Make the appropriate adjustments to your VBA script to enable it to run on every worksheet (that is, every year) at once.
\begin{tabular}{|c|c|c|c|c|c|c|c|c|c|c|} \hline & & & & & & & Ticker & Yearly Change & Percent Change & Total Stock Volume \\ \hline AAB & 20180102 & 24.44 & 24.56 & 24.44 & 24.47 & 261879 & AAB & -3.12 & 12.77% & 765628638 \\ \hline AAB & 20180103 & 24.45 & 24.45 & 24.22 & 24.28 & 15721045 & AAF & -0.44 & 7.45% & 2348251513 \\ \hline AAB & 20180104 & 24.27 & 24.36 & 24.27 & 24.28 & 5954 & AAR & -0.32 & 17.11% & 44163252 \\ \hline AAB & 20180105 & 24.24 & 24.33 & 24.22 & 24.33 & 58161100 & AAT & 5.33 & 42.44% & 1121804 \\ \hline AAB & 20180108 & 24.28 & 24.72 & 24.28 & 24.72 & 267347 & ABJ & 0.20 & 0.47% & 866724156 \\ \hline AAB & 20180109 & 24.73 & 24.73 & 24.64 & 24.64 & 1129348 & ABK & 1.61 & 4.80% & 10391386 \\ \hline AAB & 20180110 & 24.62 & 24.78 & 24.57 & 24.68 & 5453423 & ABKV & 2.22 & 11.57% & 5324614313 \\ \hline AAB & 20180111 & 24.68 & 24.85 & 24.68 & 24.85 & 14391 & ABM & -1.16 & 12.96% & 1029560425 \\ \hline AAB & 20180112 & 24.86 & 24.86 & 24.71 & 24.86 & 13701 & ACJ & -0.57 & 3.70% & 6169423 \\ \hline AAB & 20180116 & 24.85 & 24.93 & 24.79 & 24.79 & 101867 & ACYQ & 2.04 & 4.79% & 234097825 \\ \hline AAB & 20180117 & 24.81 & 24.85 & 24.68 & 24.69 & 515155 & ADB & -2.40 & 8.34% & 41980152 \\ \hline AAB & 20180118 & 24.67 & 24.86 & 24.67 & 24.86 & 657377 & ADF & 0.36 & 2.74% & 13907867898 \\ \hline AAB & 20180119 & 24.89 & 24.93 & 24.71 & 24.71 & 1106987 & AEL & 2.33 & 5.11% & 4339867319 \\ \hline AAB & 20180122 & 24.66 & 24.9 & 24.66 & 24.85 & 1418811 & AEV & 2.79 & 11.71% & 843970 \\ \hline AAB & 20180123 & 24.87 & 24.94 & 24.8 & 24.84 & 52744 & AEY & -0.08 & 6.96% & 8274367 \\ \hline AAB & 20180124 & 24.83 & 24.83 & 24.56 & 24.56 & 3545845 & AFZ & 0.35 & 2.70% & 175801284 \\ \hline AAB & 20180125 & 24.58 & 24.66 & 24.54 & 24.66 & 3119820 & AGF & -1.53 & 2.46% & 1903886691 \\ \hline \end{tabular}
Step by Step Solution
There are 3 Steps involved in it

Get step-by-step solutions from verified subject matter experts