Question: Create a Strategic Group Map with Twitter, Snap Inc., and Facebook and evaluate the take away from this map: EXHIBIT 7 Snap, Inc.: Selected Financial
Create a Strategic Group Map with Twitter, Snap Inc., and Facebook and evaluate the take away from this map:
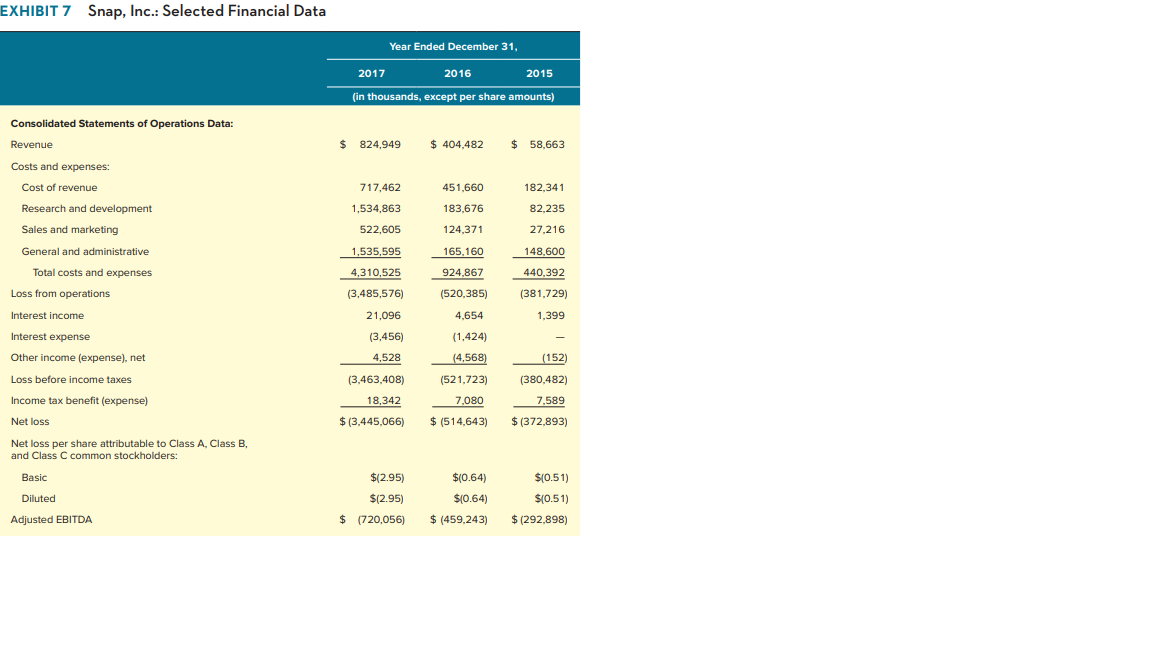
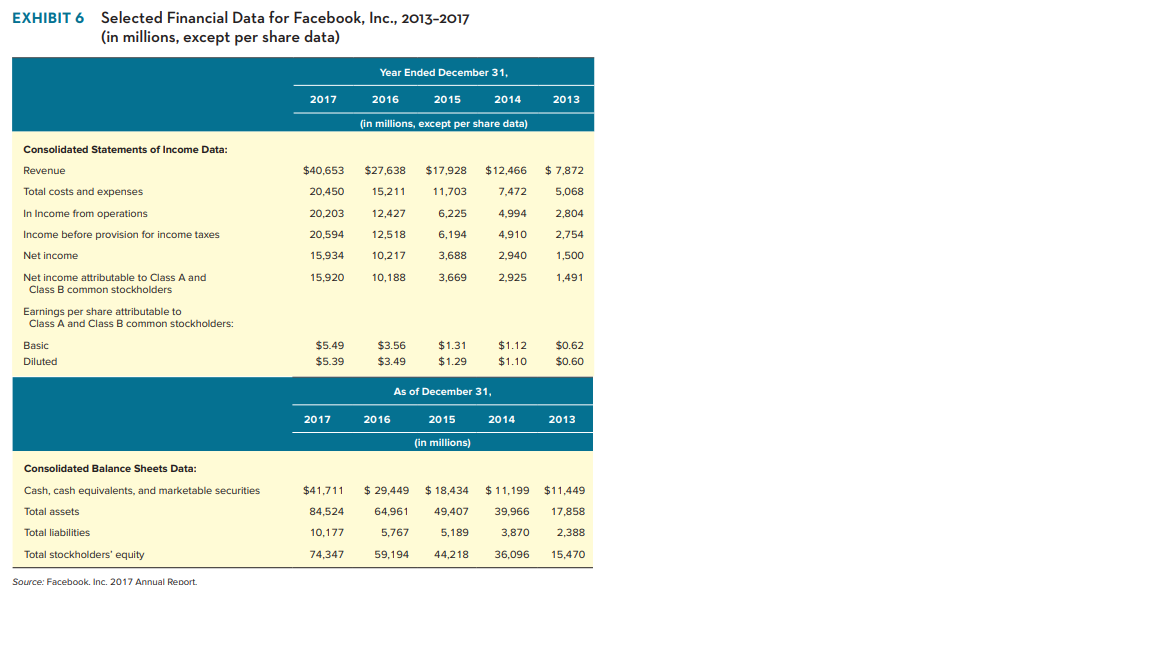
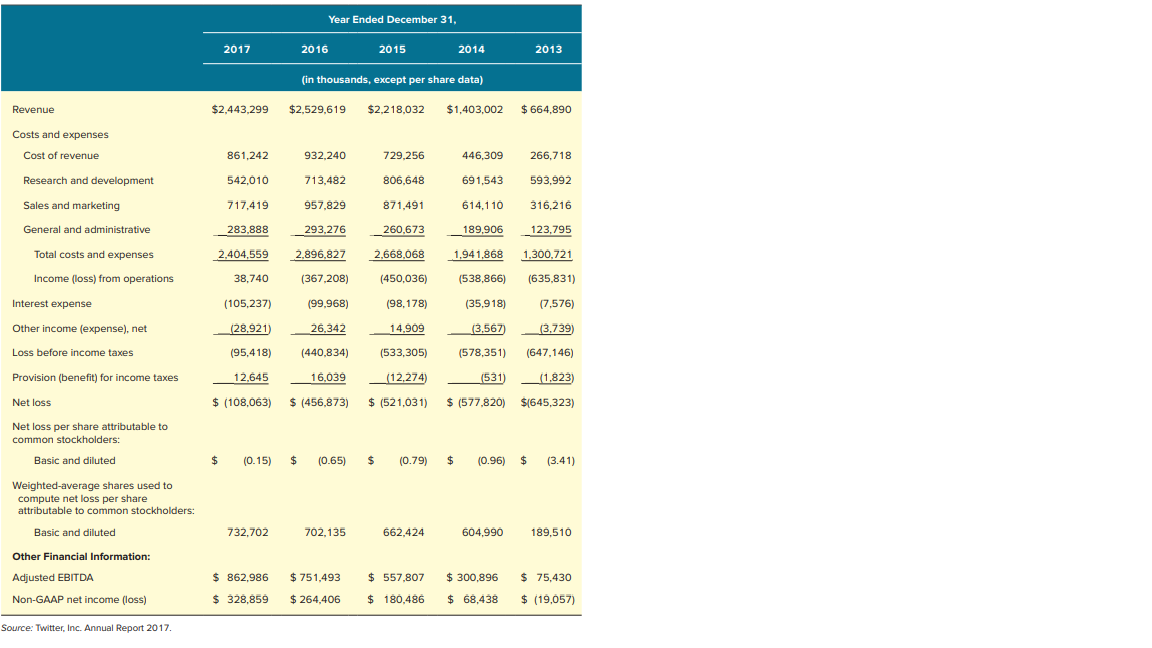
EXHIBIT 7 Snap, Inc.: Selected Financial Data Year Ended December 31, 2017 2016 2015 (in thousands, except per share amounts) Consolidated Statements of Operations Data: Revenue $ 824,949 $ 404,482 $ 58,663 Costs and expenses: Cost of revenue 717,462 451,660 182.341 1,534,863 183,676 82.235 522,605 124,371 27,216 Research and development Sales and marketing General and administrative Total costs and expenses Loss from operations 1,535,595 165,160 148,600 4,310,525 924,867 440.392 (3,485,576) (520,385) (381,729) Interest income 21,096 4,654 1,399 (1.424) (3.456) 4,528 (4,568) (152) (3.463,408) (521,723) (380.482) 18,342 7,080 7.589 Interest expense Other income (expense), net Loss before income taxes Income tax benefit (expense) Net loss Net loss per share attributable to Class A, Class B, and Class C common stockholders: Basic $ (3,445,066) $ (514,643) $ (372,893) $12.95) $12.95) Diluted $(0.64) ${0.64) $ (459,243) ${0.51) $(0.51) $(292,898) Adjusted EBITDA $ (720,056) EXHIBIT 6 Selected Financial Data for Facebook, Inc., 2013-2017 (in millions, except per share data) Year Ended December 31, 2017 2013 2016 2015 2014 (in millions, except per share data) Consolidated Statements of Income Data: Revenue $27,638 $17.928 $12,466 $ 7.872 $40,653 20,450 Total costs and expenses 15,211 11,703 7,472 5,068 In Income from operations 20,203 12,427 6,225 4,994 2,804 Income before provision for income taxes 20,594 12,518 6,194 4,910 2.754 Net income 15,934 10,217 3,688 2.940 1,500 15,920 10,188 3,669 2.925 1.491 Net income attributable to Class A and Class B common stockholders Earnings per share attributable to Class A and Class B common stockholders: Basic Diluted $5.49 $5.39 $3.56 $3.49 $1.31 $1.29 $1.12 $1.10 $0.62 $0.60 As of December 31, 2017 2016 2015 2014 2013 (in millions) Consolidated Balance Sheets Data: Cash, cash equivalents, and marketable securities $41,711 $ 29,449 $ 18,434 $ 11,199 $11.449 Total assets 84,524 64,961 49,407 39.966 17,858 Total liabilities 10.177 5,767 5,189 3,870 2,388 Total stockholders' equity 74,347 59,194 44,218 36,096 15,470 Source: Facebook, Inc. 2017 Annual Report. Year Ended December 31, 2017 2016 2015 2014 2013 (in thousands, except per share data) Revenue $2.443,299 $2,529,619 $2,218,032 $1,403,002 $ 664,890 Costs and expenses Cost of revenue 861,242 932,240 729,256 446,309 266,718 Research and development 542,010 713.482 806,648 691,543 593,992 Sales and marketing 717,419 957.829 871,491 614,110 316,216 General and administrative 283,888 293,276 260,673 189,906 123,795 2.404,559 2,896,827 2.668.068 1,941,868 1,300,721 Total costs and expenses Income (loss) from operations 38,740 (367,208) (450,036) (538,866) (635.831) Interest expense (105,237) 199,968) ) (98, 178) (35,918) (7,576) Other income (expense), net (28,921 26,342 14.909 (3,567) (3,739) Loss before income taxes (95,418) (440,834) (533,305) (578,351) (647,146) Provision (benefit) for income taxes 12,645 16.039 (12,274) (531) (1.823) Net loss $ (108,063) $ (456,873) $ (521,031) $ (577,820) $(645,323) Net loss per share attributable to common stockholders: Basic and diluted $ (0.15) $ (0.65) $ (0.79) $ (0.96) $ (3.41) Weighted average shares used to compute net loss per share attributable to common stockholders: : Basic and diluted 732,702 702,135 662,424 604,990 189,510 Other Financial Information: Adjusted EBITDA $ 862,986 $ 751,493 $ 557,807 $ 300,896 $ 75,430 Non-GAAP net income (oss) $ 328,859 $ 264,406 $ 180,486 $ 68,438 $ (19,057) Source: Twitter, Inc. Annual Report 2017. EXHIBIT 7 Snap, Inc.: Selected Financial Data Year Ended December 31, 2017 2016 2015 (in thousands, except per share amounts) Consolidated Statements of Operations Data: Revenue $ 824,949 $ 404,482 $ 58,663 Costs and expenses: Cost of revenue 717,462 451,660 182.341 1,534,863 183,676 82.235 522,605 124,371 27,216 Research and development Sales and marketing General and administrative Total costs and expenses Loss from operations 1,535,595 165,160 148,600 4,310,525 924,867 440.392 (3,485,576) (520,385) (381,729) Interest income 21,096 4,654 1,399 (1.424) (3.456) 4,528 (4,568) (152) (3.463,408) (521,723) (380.482) 18,342 7,080 7.589 Interest expense Other income (expense), net Loss before income taxes Income tax benefit (expense) Net loss Net loss per share attributable to Class A, Class B, and Class C common stockholders: Basic $ (3,445,066) $ (514,643) $ (372,893) $12.95) $12.95) Diluted $(0.64) ${0.64) $ (459,243) ${0.51) $(0.51) $(292,898) Adjusted EBITDA $ (720,056) EXHIBIT 6 Selected Financial Data for Facebook, Inc., 2013-2017 (in millions, except per share data) Year Ended December 31, 2017 2013 2016 2015 2014 (in millions, except per share data) Consolidated Statements of Income Data: Revenue $27,638 $17.928 $12,466 $ 7.872 $40,653 20,450 Total costs and expenses 15,211 11,703 7,472 5,068 In Income from operations 20,203 12,427 6,225 4,994 2,804 Income before provision for income taxes 20,594 12,518 6,194 4,910 2.754 Net income 15,934 10,217 3,688 2.940 1,500 15,920 10,188 3,669 2.925 1.491 Net income attributable to Class A and Class B common stockholders Earnings per share attributable to Class A and Class B common stockholders: Basic Diluted $5.49 $5.39 $3.56 $3.49 $1.31 $1.29 $1.12 $1.10 $0.62 $0.60 As of December 31, 2017 2016 2015 2014 2013 (in millions) Consolidated Balance Sheets Data: Cash, cash equivalents, and marketable securities $41,711 $ 29,449 $ 18,434 $ 11,199 $11.449 Total assets 84,524 64,961 49,407 39.966 17,858 Total liabilities 10.177 5,767 5,189 3,870 2,388 Total stockholders' equity 74,347 59,194 44,218 36,096 15,470 Source: Facebook, Inc. 2017 Annual Report. Year Ended December 31, 2017 2016 2015 2014 2013 (in thousands, except per share data) Revenue $2.443,299 $2,529,619 $2,218,032 $1,403,002 $ 664,890 Costs and expenses Cost of revenue 861,242 932,240 729,256 446,309 266,718 Research and development 542,010 713.482 806,648 691,543 593,992 Sales and marketing 717,419 957.829 871,491 614,110 316,216 General and administrative 283,888 293,276 260,673 189,906 123,795 2.404,559 2,896,827 2.668.068 1,941,868 1,300,721 Total costs and expenses Income (loss) from operations 38,740 (367,208) (450,036) (538,866) (635.831) Interest expense (105,237) 199,968) ) (98, 178) (35,918) (7,576) Other income (expense), net (28,921 26,342 14.909 (3,567) (3,739) Loss before income taxes (95,418) (440,834) (533,305) (578,351) (647,146) Provision (benefit) for income taxes 12,645 16.039 (12,274) (531) (1.823) Net loss $ (108,063) $ (456,873) $ (521,031) $ (577,820) $(645,323) Net loss per share attributable to common stockholders: Basic and diluted $ (0.15) $ (0.65) $ (0.79) $ (0.96) $ (3.41) Weighted average shares used to compute net loss per share attributable to common stockholders: : Basic and diluted 732,702 702,135 662,424 604,990 189,510 Other Financial Information: Adjusted EBITDA $ 862,986 $ 751,493 $ 557,807 $ 300,896 $ 75,430 Non-GAAP net income (oss) $ 328,859 $ 264,406 $ 180,486 $ 68,438 $ (19,057) Source: Twitter, Inc. Annual Report 2017


