

Question: Create a Temperature vs Time graph using the attached data set below with two lines, one for the Ice/Cold Water, and another for the Hot
Create a Temperature vs Time graph using the attached data set below with two lines, one for the Ice/Cold Water, and another for the Hot Water. Start/end temperatures on the graph should reflect the values in the data, but time scale does not need to be indicated. For the graph, imagine that while energy is transferred between the Hot Water and the Cold Water/Ice, that they theoretically remain separate, and don't physically mix.
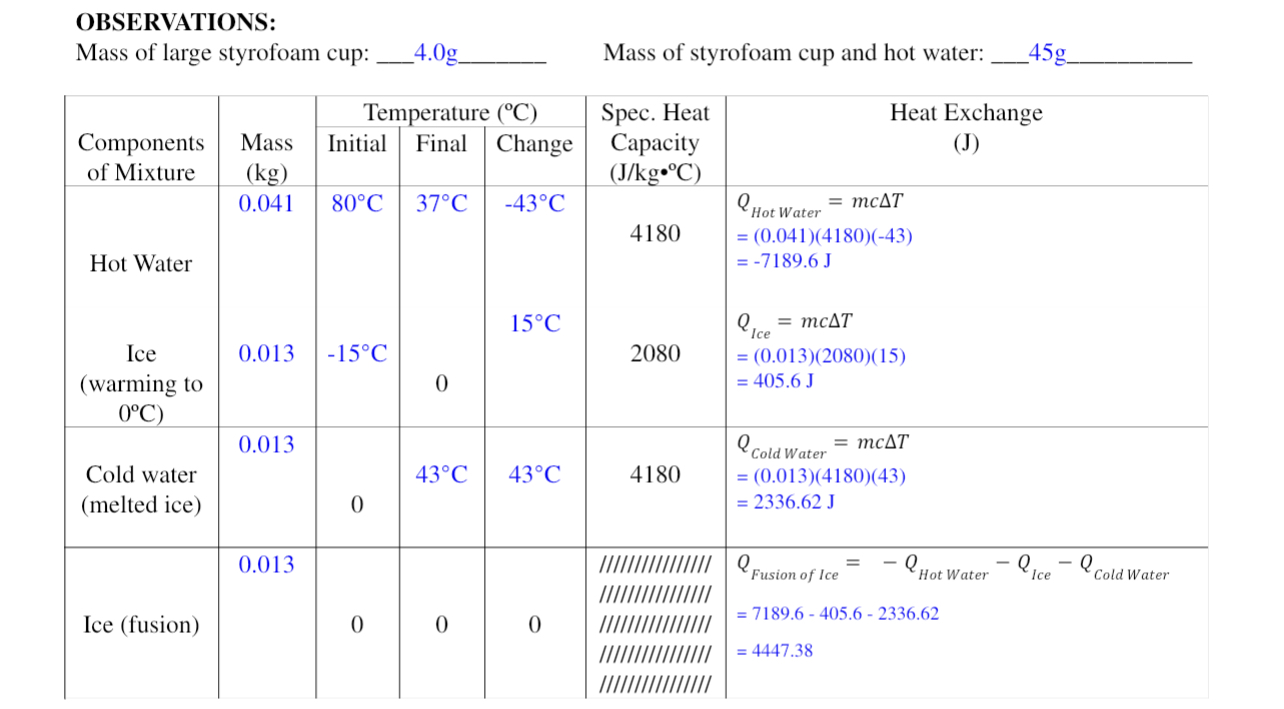
OBSERVATIONS: Mass of large styrofoam cup: _4.0g Mass of styrofoam cup and hot water: 45g Temperature (C) Spec. Heat Heat Exchange Components Mass Initial Final Change Capacity (J) of Mixture (kg) (J/kg. C) 0.041 80 C 37.C -43 .C Hot Water = mcAT 4180 = (0.041)(4180)(-43) Hot Water = -7189.6 J 15.C Q, = mcAT Ice 0.013 -15.C 2080 = (0.013)(2080)(15) (warming to 0 = 405.6 J 0'C) 0.013 Cold Water = mcAT Cold water 43.C 43 .C 4180 = (0.013)(4180)(43) (melted ice) 0 = 2336.62 J 0.013 Fusion of Ice -Hot Water - Ice Cold Water Ice (fusion) 0 0 0 = 7189.6 - 405.6 - 2336.62 = 4447.38
Step by Step Solution
There are 3 Steps involved in it

Get step-by-step solutions from verified subject matter experts