

Question: Create a useful dashboard for the data provided. Use appropriate charts and layouts and other visualization tools that help to convey the information. Explain why
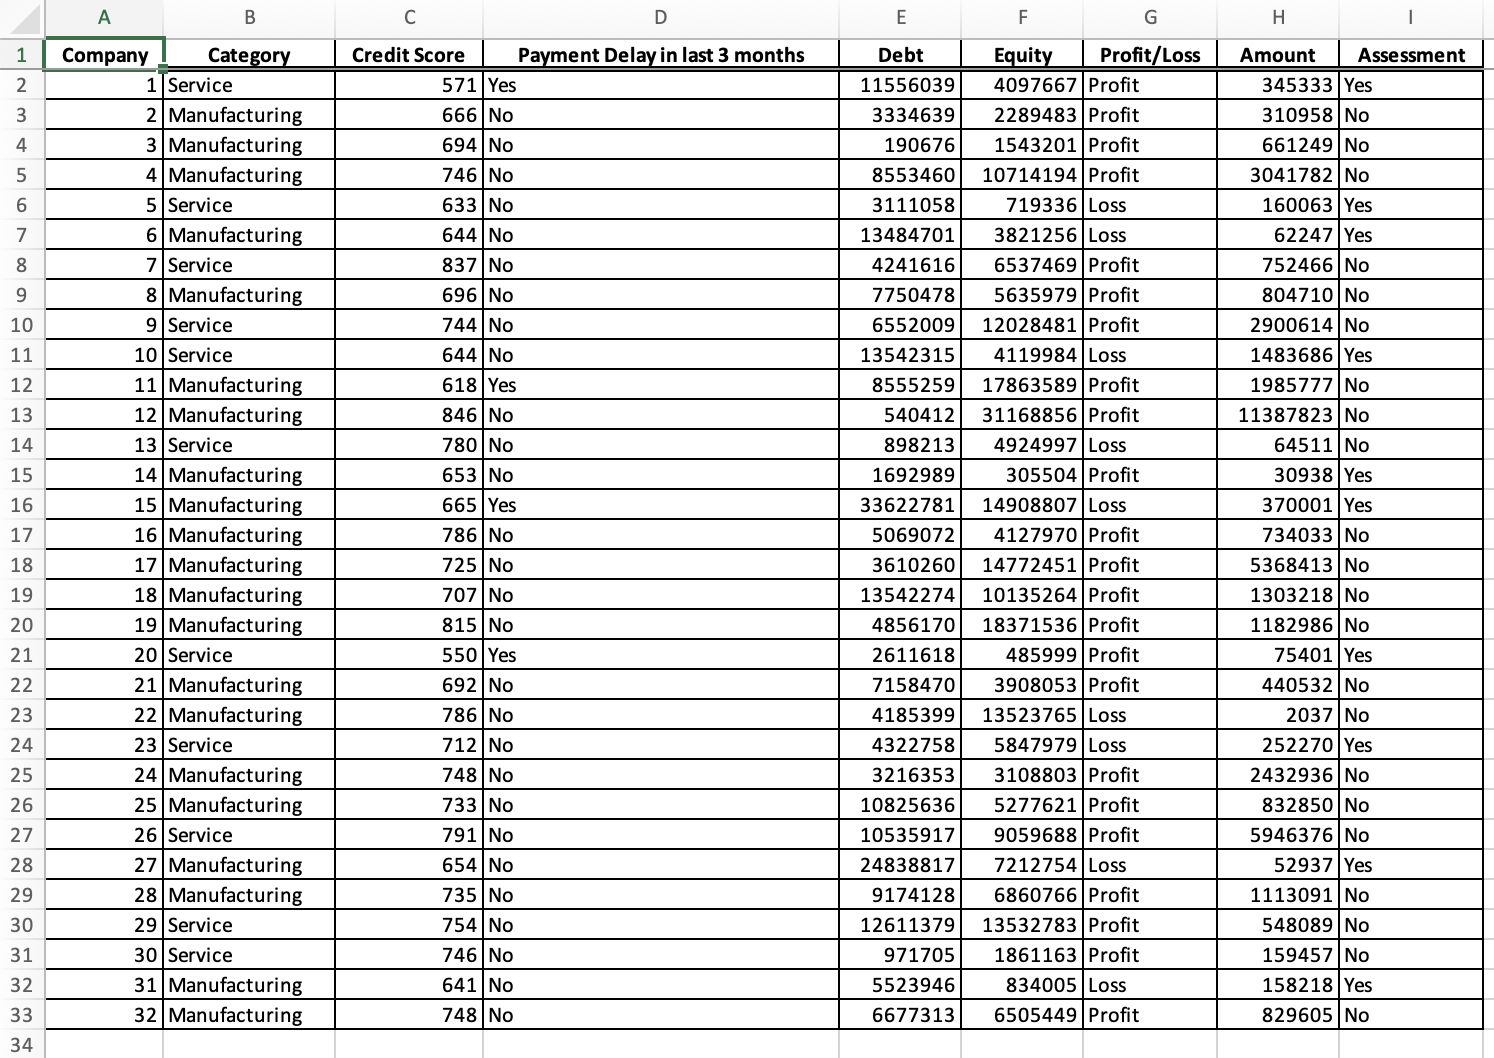
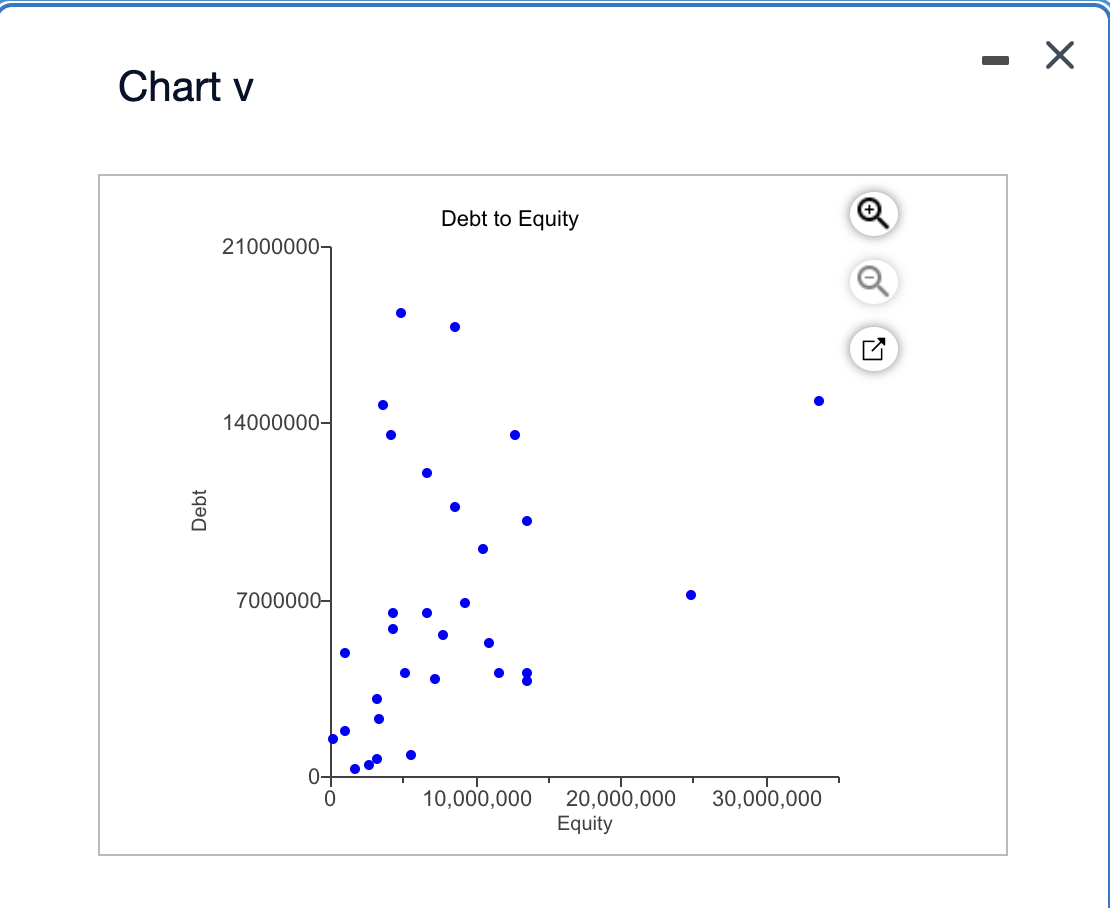
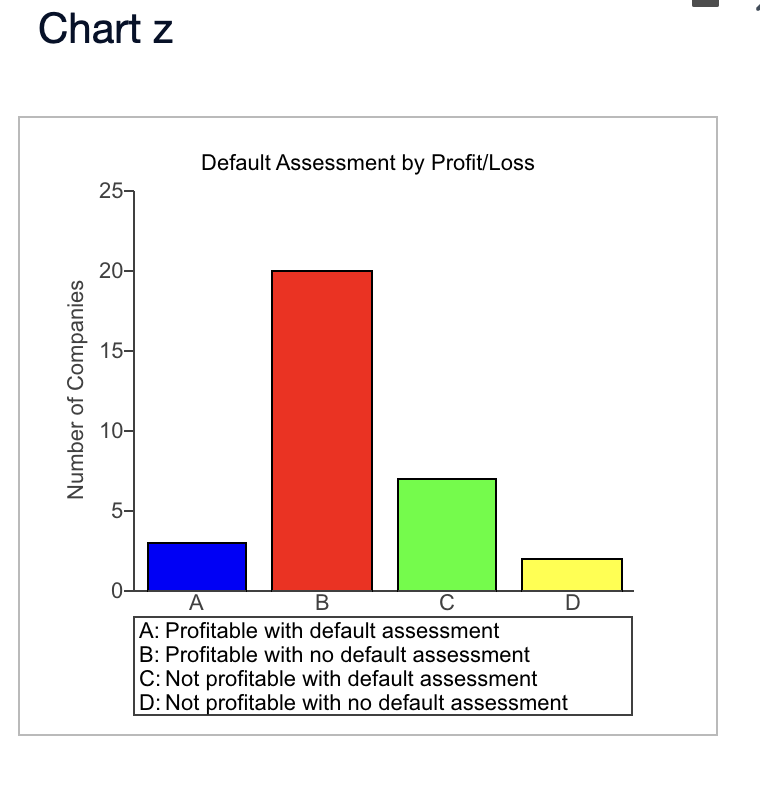
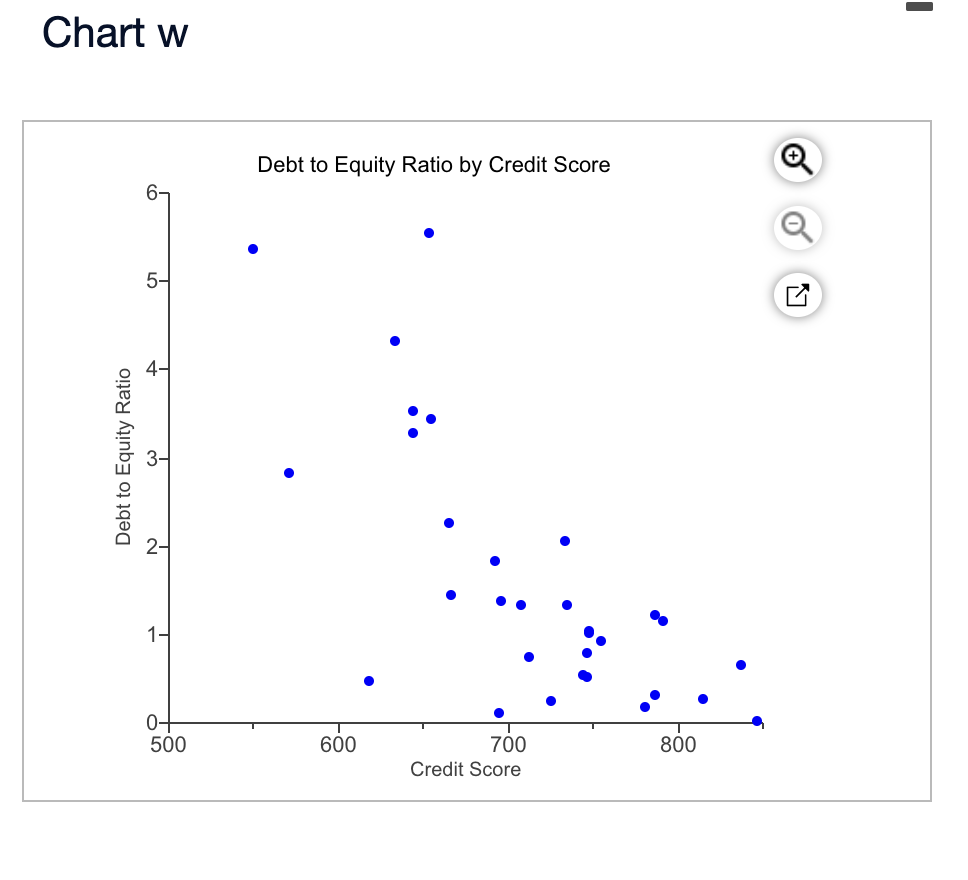
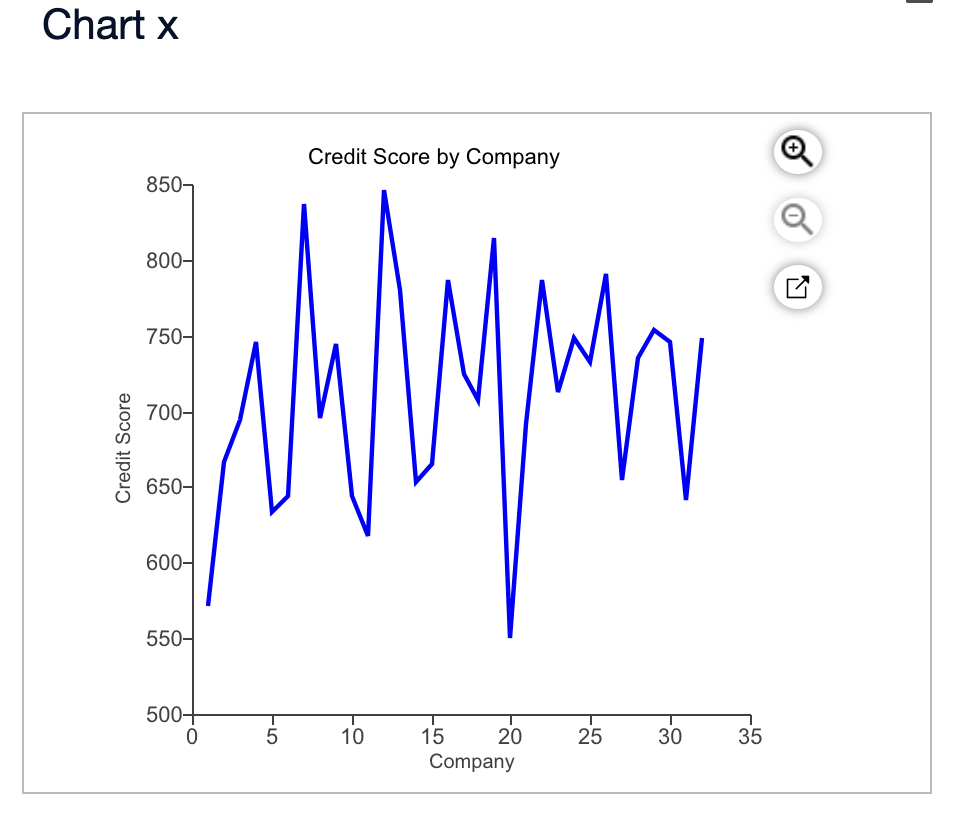
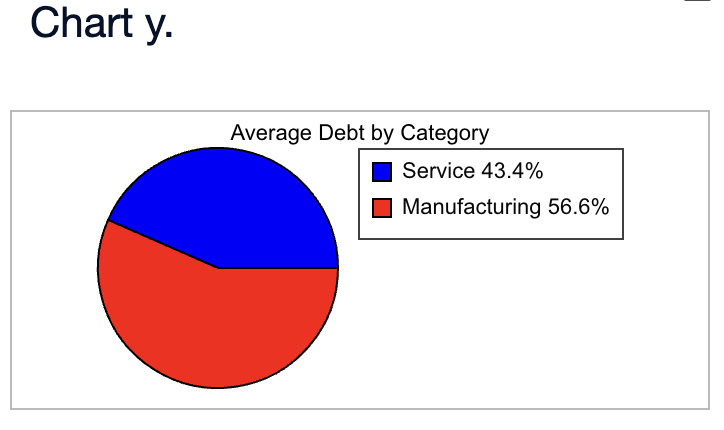
Create a useful dashboard for the data provided. Use appropriate charts and layouts and other visualization tools that help to convey the information. Explain why you chose the elements of the dashboards and how a manager might use them. Click the icon to view the corporate default database. Identify the charts that would be useful in a dashboard. Select all that apply. A. Click here to view chart v. B. Click here to view chart z. C. Click here to view chart w. D. Click here to view chart x. E. Click here to view chart y. Why are the selected charts useful in a dashboard? A. The selected charts each use different data in order to make fair comparisons. B. The selected charts all use different types of graphs. C. The selected charts contain all of the data that was provided. A B C D \begin{tabular}{l|ll} E & F & G \end{tabular} H \begin{tabular}{|c|c|c|c|c|c|c|c|c|} \hline Company & Category & Credit Score & Payment Delay in last 3 months & Debt & Equity & Profit/Loss & Amount & Assessment \\ \hline 1 & Service & 571 & Yes & 11556039 & 4097667 & Profit & 345333 & Yes \\ \hline 2 & Manufacturing & 666 & No & 3334639 & 2289483 & Profit & 310958 & No \\ \hline 3 & Manufacturing & 694 & No & 190676 & 1543201 & Profit & 661249 & No \\ \hline 4 & Manufacturing & 746 & No & 8553460 & 10714194 & Profit & 3041782 & No \\ \hline 5 & Service & 633 & No & 3111058 & 719336 & Loss & 160063 & Yes \\ \hline 6 & Manufacturing & 644 & No & 13484701 & 3821256 & Loss & 62247 & Yes \\ \hline 7 & Service & 837 & No & 4241616 & 6537469 & Profit & 752466 & No \\ \hline 9 & Service & 744 & No & 6552009 & 12028481 & Profit & 2900614 & No \\ \hline 10 & Service & 644 & No & 13542315 & 4119984 & Loss & 1483686 & Yes \\ \hline 11 & Manufacturing & 618 & Yes & 8555259 & 17863589 & Profit & 1985777 & No \\ \hline 12 & Manufacturing & 846 & No & 540412 & 31168856 & Profit & 11387823 & No \\ \hline 13 & Service & 780 & No & 898213 & 4924997 & Loss & 64511 & No \\ \hline 14 & Manufacturing & 653 & No & 1692989 & 305504 & Profit & 30938 & Yes \\ \hline 15 & Manufacturing & 665 & Yes & 33622781 & 14908807 & Loss & 370001 & Yes \\ \hline 17 & Manufacturing & 725 & No & 3610260 & 14772451 & Profit & 5368413 & No \\ \hline 18 & Manufacturing & 707 & No & 13542274 & 10135264 & Profit & 1303218 & No \\ \hline 19 & Manufacturing & 815 & No & 4856170 & 18371536 & Profit & 1182986 & No \\ \hline 20 & Service & 550 & Yes & 2611618 & 485999 & Profit & 75401 & Yes \\ \hline 21 & Manufacturing & 692 & No & 7158470 & 3908053 & Profit & 440532 & No \\ \hline 22 & Manufacturing & 786 & No & 4185399 & 13523765 & Loss & 2037 & No \\ \hline 23 & Service & 712 & No & 4322758 & 5847979 & Loss & 252270 & Yes \\ \hline 24 & Manufacturing & 748 & No & 3216353 & 3108803 & Profit & 2432936 & No \\ \hline 25 & Manufacturing & 733 & No & 10825636 & 5277621 & Profit & 832850 & No \\ \hline 26 & Service & 791 & No & 10535917 & 9059688 & Profit & 5946376 & No \\ \hline 27 & Manufacturing & 654 & No & 24838817 & 7212754 & Loss & 52937 & Yes \\ \hline 28 & Manufacturing & 735 & No & 9174128 & 6860766 & Profit & 1113091 & No \\ \hline 29 & Service & 754 & No & 12611379 & 13532783 & Profit & 548089 & No \\ \hline 30 & Service & 746 & No & 971705 & 1861163 & Profit & 159457 & No \\ \hline 31 & Manufacturing & 641 & No & 5523946 & 834005 & Loss & 158218 & Yes \\ \hline \end{tabular} Chart v Chart z Chart w Chart x Chart y
Step by Step Solution
There are 3 Steps involved in it

Get step-by-step solutions from verified subject matter experts