

Question: Create a useful dashboard for the data provided. Use appropriate charts and layouts and other visualization tools that help to convey the information. Explain why
Create a useful dashboard for the data provided. Use appropriate charts and layouts and other visualization tools that help to convey the information. Explain why you chose the elements of the dashboards and how a manager might use them.
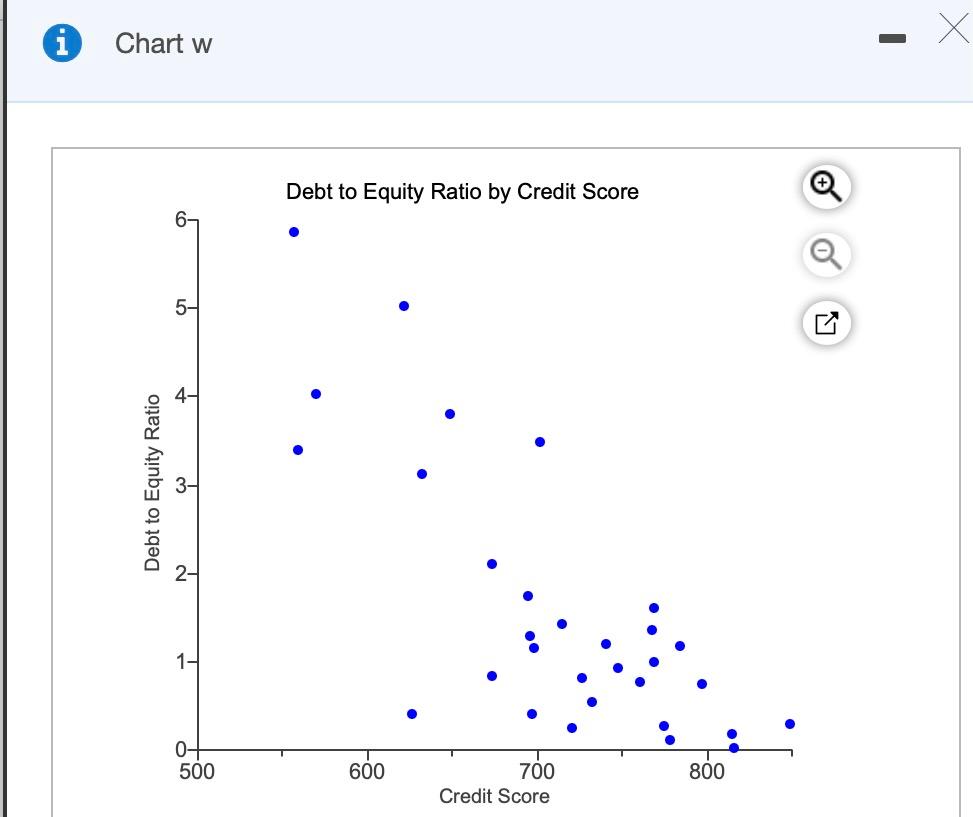
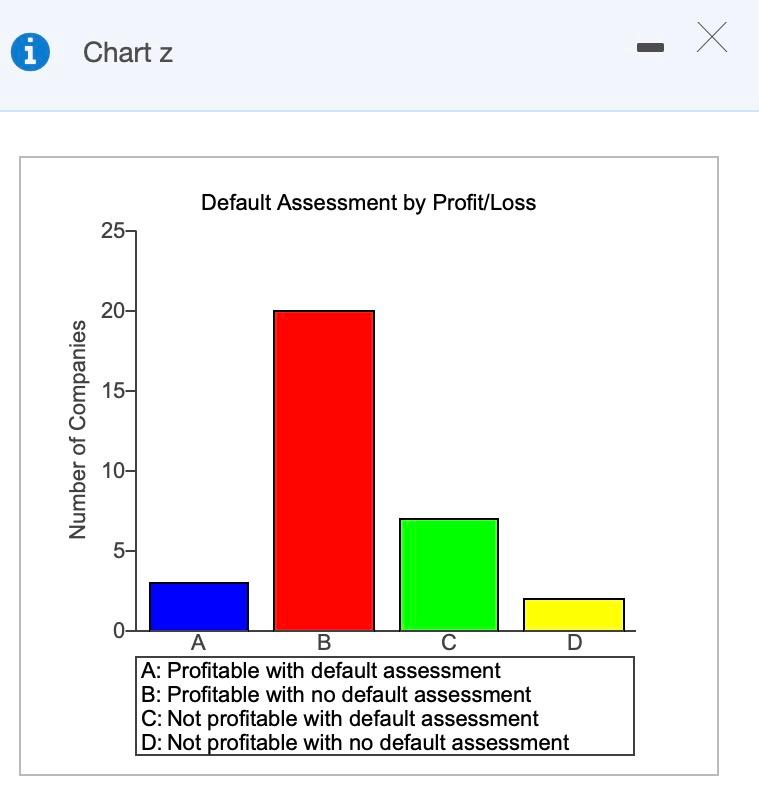
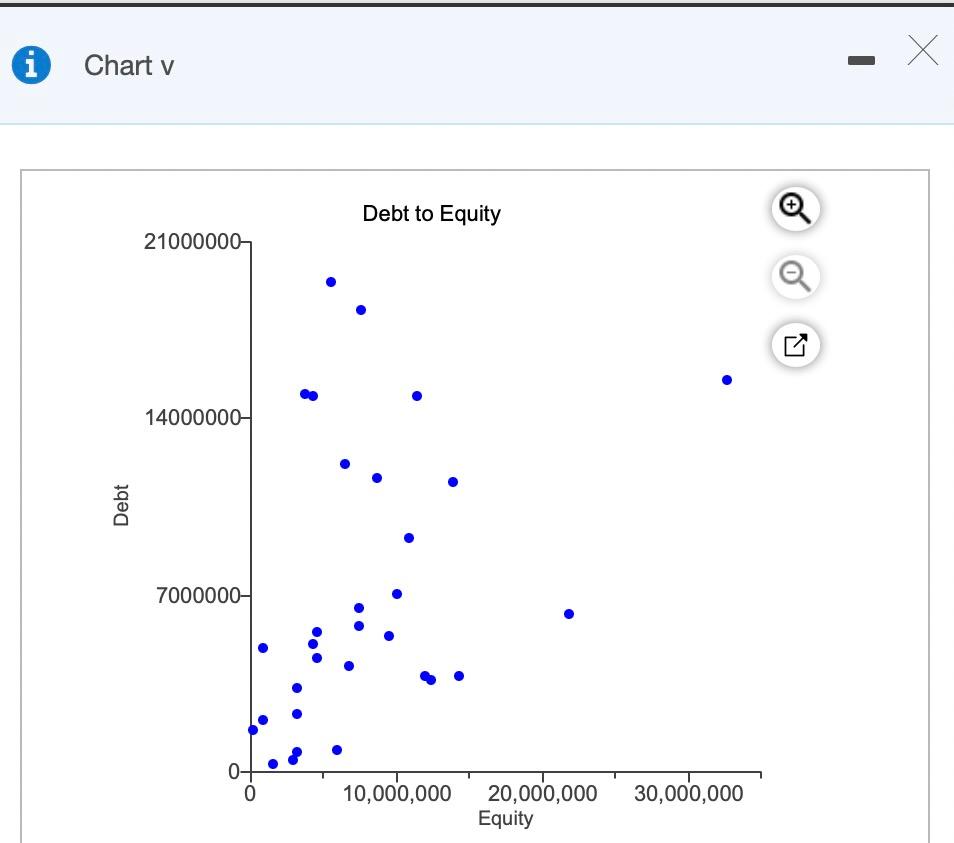
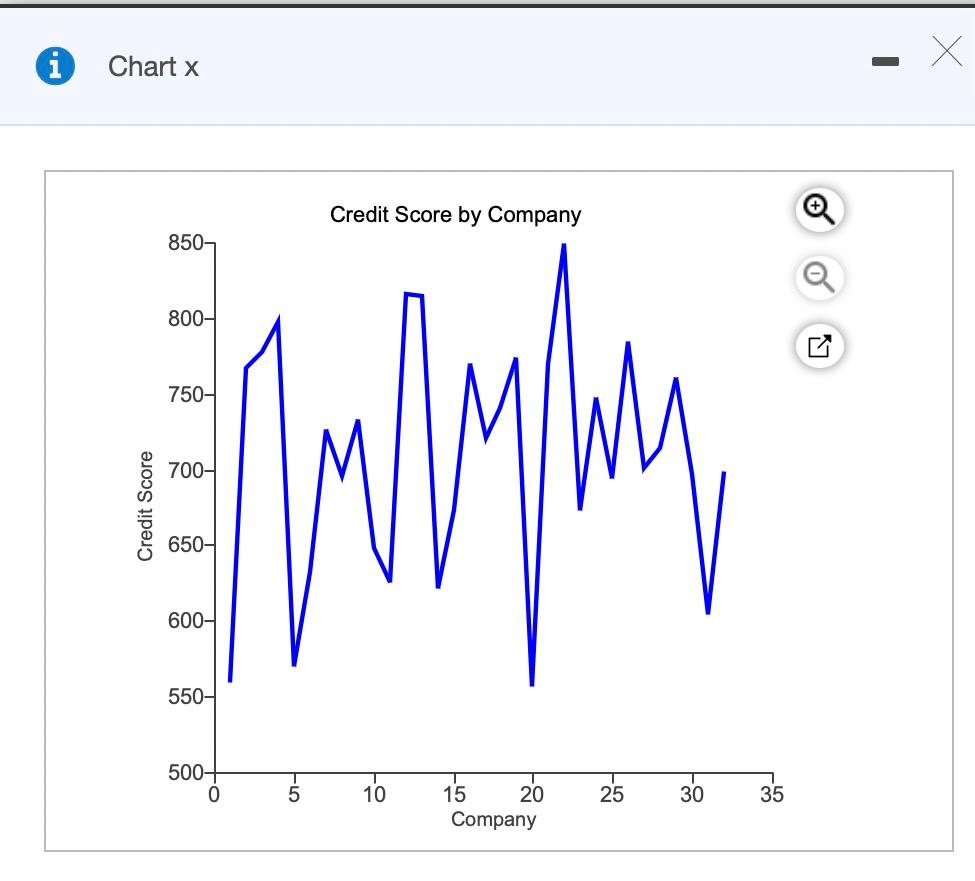
| Company | Category | Credit Score | Payment Delay in last 3 months | Debt | Equity | Profit/Loss | Amount | Assessment |
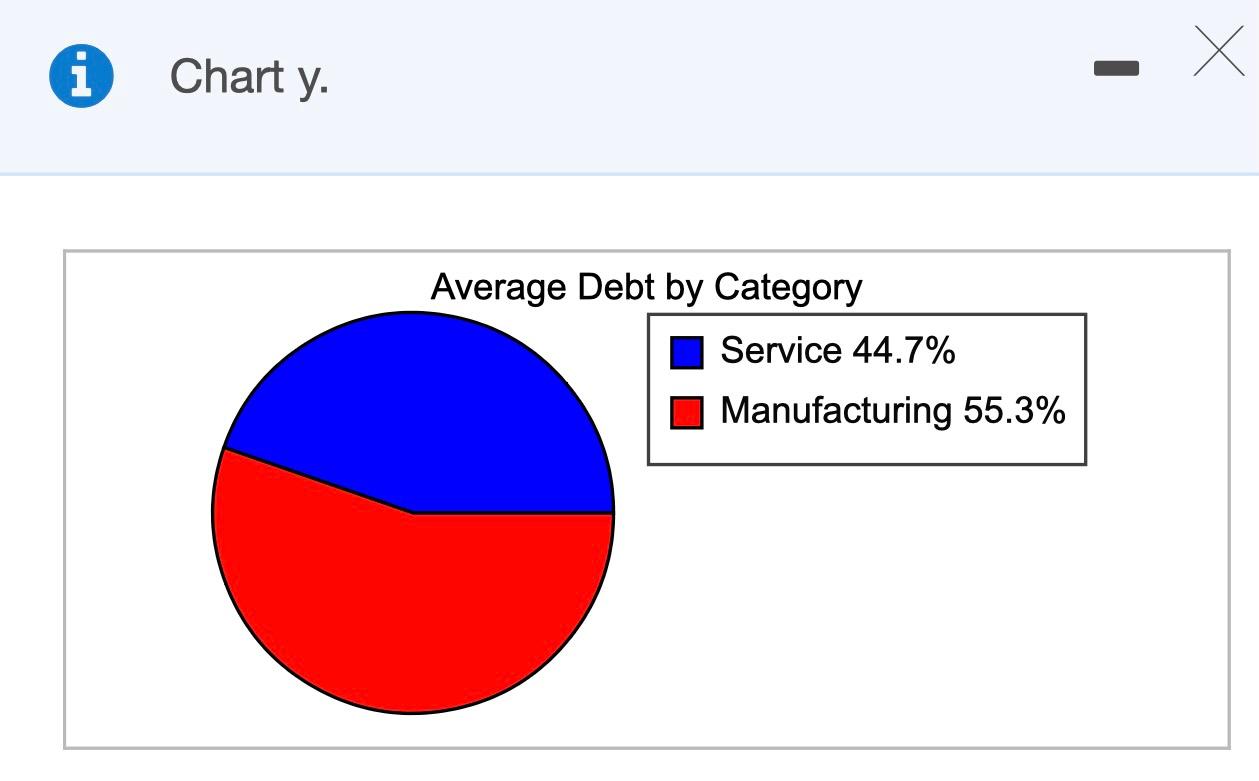
| 1 | Service | 559 | Yes | 12375932 | 3649308 | Profit | 364258 | Yes |
| 2 | Manufacturing | 767 | No | 3137705 | 2320034 | Profit | 272368 | No |
| 3 | Manufacturing | 778 | No | 202663 | 1695982 | Profit | 653026 | No |
| 4 | Manufacturing | 797 | No | 8638986 | 11660888 | Profit | 2954113 | No |
| 5 | Service | 570 | No | 3105069 | 769266 | Loss | 148460 | Yes |
| 6 | Manufacturing | 632 | No | 11952974 | 3812920 | Loss | 73429 | Yes |
| 7 | Service | 726 | No | 4588332 | 5577786 | Profit | 706089 | No |
| 8 | Manufacturing | 696 | No | 7443200 | 5752913 | Profit | 759807 | No |
| 9 | Service | 732 | No | 6484266 | 12170289 | Profit | 3098076 | No |
| 10 | Service | 648 | No | 14316361 | 3766156 | Loss | 1457913 | Yes |
| 11 | Manufacturing | 626 | Yes | 7501686 | 18297115 | Profit | 2186384 | No |
| 12 | Manufacturing | 816 | No | 543706 | 30239263 | Profit | 12233942 | No |
| 13 | Service | 815 | No | 865586 | 4921400 | Loss | 70928 | No |
| 14 | Manufacturing | 621 | No | 1480728 | 294989 | Profit | 34490 | Yes |
| 15 | Manufacturing | 673 | Yes | 32719362 | 15568975 | Loss | 383348 | Yes |
| 16 | Manufacturing | 769 | No | 4472189 | 4488483 | Profit | 698270 | No |
| 17 | Manufacturing | 720 | No | 3667646 | 15005944 | Profit | 5804610 | No |
| 18 | Manufacturing | 740 | No | 13822199 | 11509156 | Profit | 1495537 | No |
| 19 | Manufacturing | 774 | No | 5461203 | 19402408 | Profit | 1338693 | No |
| 20 | Service | 557 | Yes | 2916213 | 496488 | Profit | 79341 | Yes |
| 21 | Manufacturing | 769 | No | 6689981 | 4187446 | Profit | 404073 | No |
| 22 | Manufacturing | 849 | No | 4286849 | 14899931 | Loss | 1793 | No |
| 23 | Service | 673 | No | 4250585 | 5070339 | Loss | 262541 | Yes |
| 24 | Manufacturing | 747 | No | 3103500 | 3332758 | Profit | 2813962 | No |
| 25 | Manufacturing | 694 | No | 9480074 | 5425844 | Profit | 723565 | No |
| 26 | Service | 784 | No | 10777848 | 9233226 | Profit | 5814363 | No |
| 27 | Manufacturing | 701 | No | 21807168 | 6239991 | Loss | 48281 | Yes |
| 28 | Manufacturing | 714 | No | 10065484 | 7079479 | Profit | 1034115 | No |
| 29 | Service | 760 | No | 11342571 | 14892880 | Profit | 485132 | No |
| 30 | Service | 697 | No | 827115 | 2064942 | Profit | 157334 | No |
| 31 | Manufacturing | 605 | No | 5881655 | 908360 | Loss | 144731 | Yes |
| 32 | Manufacturing | 698 | No | 7397398 | 6460687 | Profit | 942999 | No |
Identify the charts that would be useful in a dashboard. Select all that apply.
Step by Step Solution
There are 3 Steps involved in it
1 Expert Approved Answer
Step: 1 Unlock

Question Has Been Solved by an Expert!
Get step-by-step solutions from verified subject matter experts
Step: 2 Unlock
Step: 3 Unlock