

Question: Create an interactive excel model that helps you in answering the following questions: then graph the relation ship between the quantity Q and the total
Create an interactive excel model that helps you in answering the following questions:
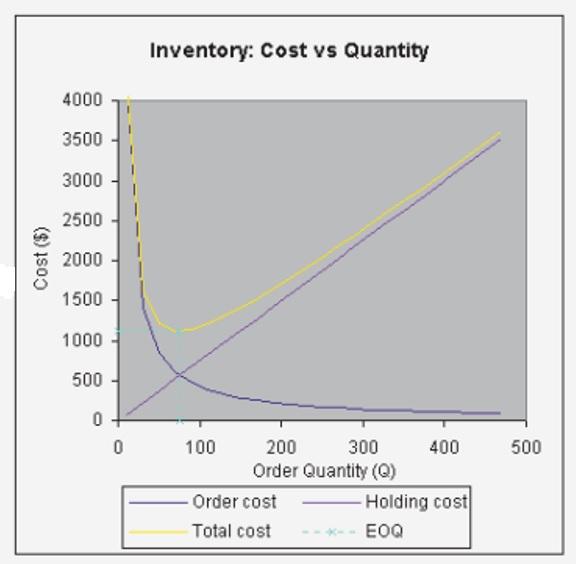
then graph the relation ship between the quantity Q and the total cost and the holding cost and the ordering cost
your graph might looks like the below photo
Note: create and suppose data in the Excel sheet from your own mind, and please show the formulas
- What happens to the EOQ (Economic order quantity) and the total cost when demand is doubled?
- What happens to the EOQ and the total cost when unit price is doubled?
- What is the annual cost of holding inventory at the EOQ and the annual cost of ordering inventory at the EOQ?
- Comment on the sensitivity of the EOQ model to errors in demand or cost estimates.
- How much does the total cost increase if the store manager orders twice as many units as the EOQ?
- How much does the total cost increase if the store manager orders half as many units as the EOQ?
- What is the EOQ and what is the lowest total cost?
- What happens to the EOQ if the order cost goes lower?
- What can you conclude about the relationship between the lowest total cost and the costs of ordering and holding inventory?
Step by Step Solution
There are 3 Steps involved in it
1 Expert Approved Answer
Step: 1 Unlock

Question Has Been Solved by an Expert!
Get step-by-step solutions from verified subject matter experts
Step: 2 Unlock
Step: 3 Unlock