

Question: Create an X-bar and R chart in Excel and plot your statistical process control (SPC) results in each chart. Please provide Excel screenshots of the
Create an X-bar and R chart in Excel and plot your statistical process control (SPC) results in each chart. Please provide Excel screenshots of the Xbar chart and the R chart as your answer. Provide excel steps of how you generated each chart.
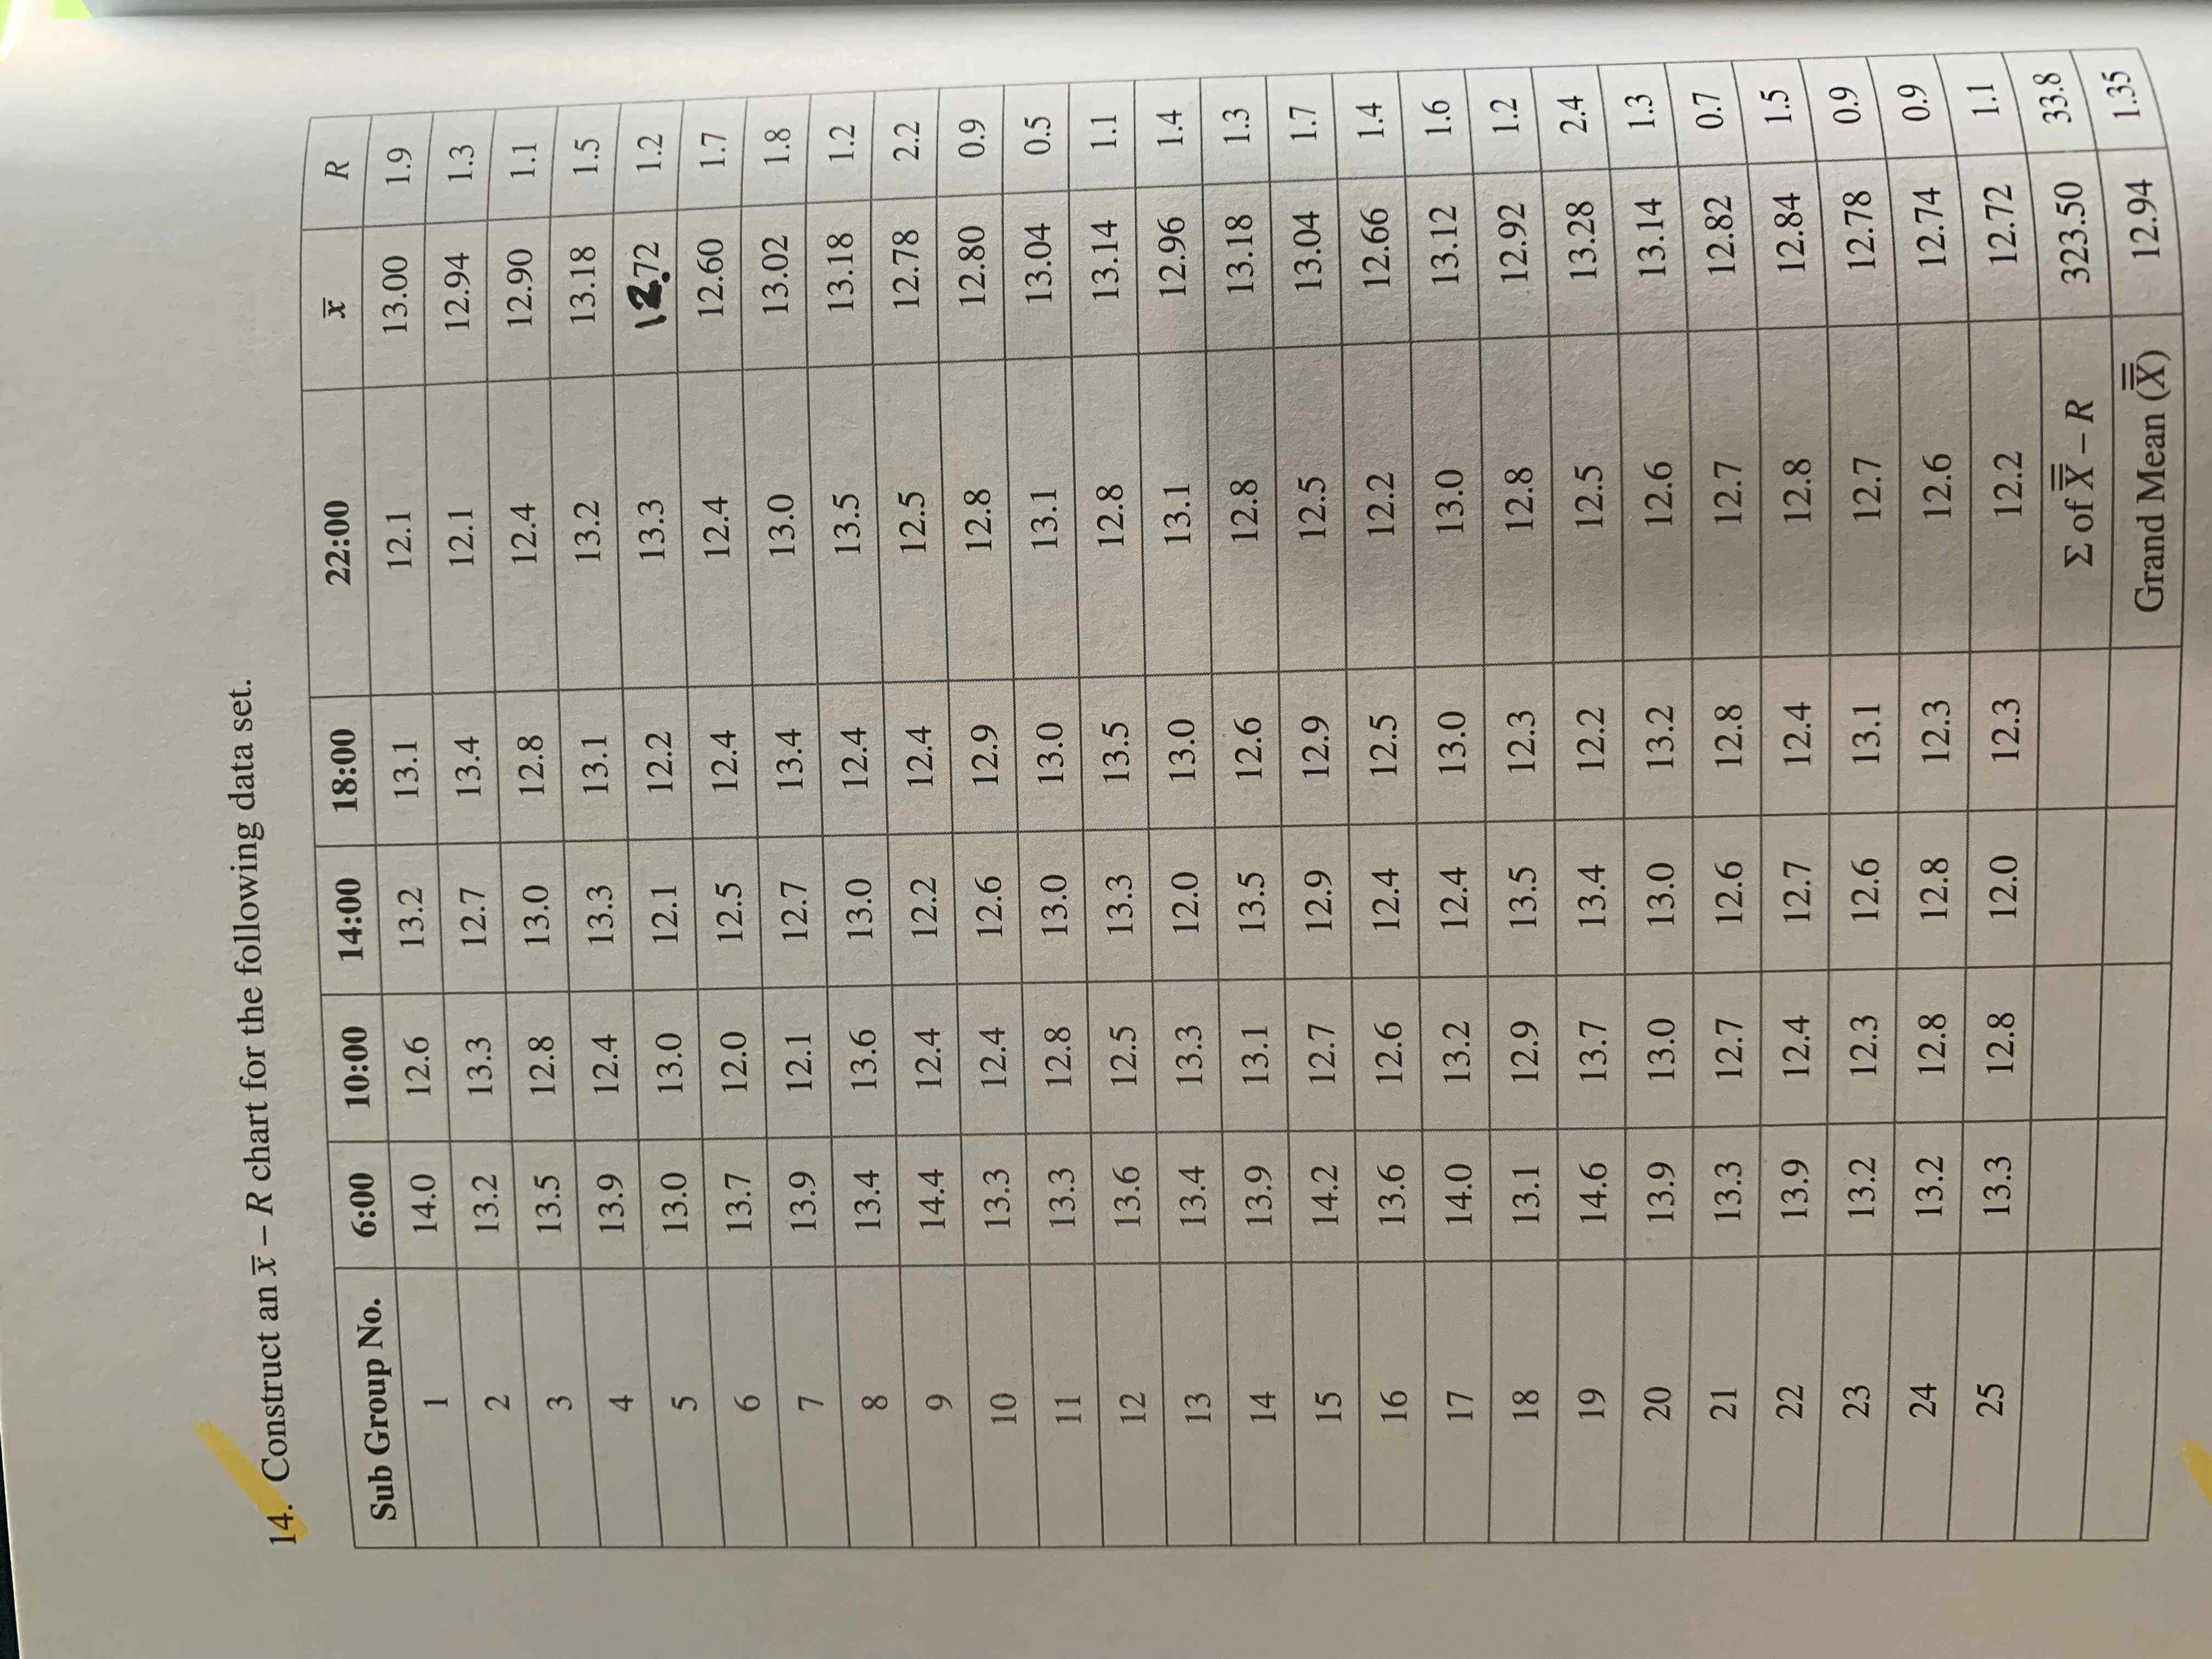
14. Construct an xR chart for the following data set
Step by Step Solution
There are 3 Steps involved in it
1 Expert Approved Answer
Step: 1 Unlock

Question Has Been Solved by an Expert!
Get step-by-step solutions from verified subject matter experts
Step: 2 Unlock
Step: 3 Unlock