

Question: Create Descriptive Analytics ChartDiagnostic Analytics ChartPredictive Analytics Chart Appendix 5: Starbucks Corporation's Financials Starbucks Corporation's Financials for Fiscal Year ending September of each year (All
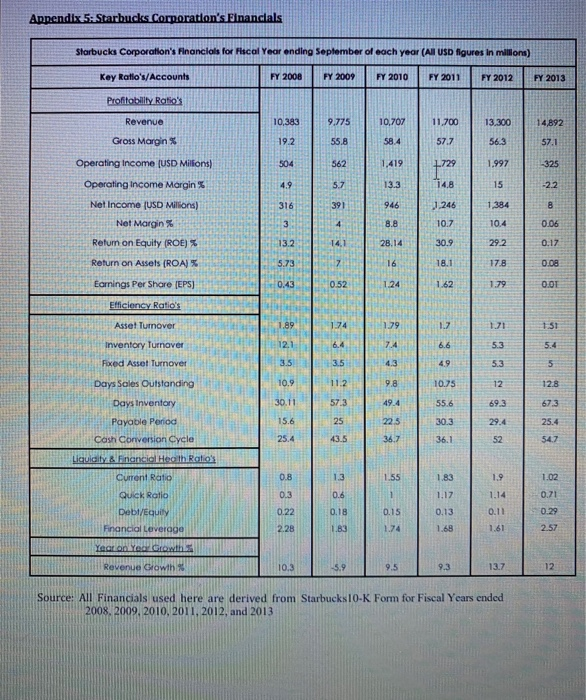
Appendix 5: Starbucks Corporation's Financials Starbucks Corporation's Financials for Fiscal Year ending September of each year (All USD figures in millions) Key Ratio's/Accounts FY 2008 FY 2009 FY 2010 FY 2011 FY 2012 FY 2013 Profitability Ratio's 10.383 9.775 10,707 11,700 13.300 14,892 Revenue Gross Margin 19.2 55,8 58.4 57.7 56.3 57.1 504 562 1.419 1.729 1.997 -325 4.9 5.7 13.3 14.8 15 -2.2 Operating Income (USD Millions) Operating Income Morgin% Net Income (USD Milions) Net Margin 316 391 946 01.246 1,384 8 3 4 8.8 10.7 10.4 0.06 Return on Equity (ROE) % 13.2 14,1 28.14 30.9 292 0.17 Return on Assets (ROA) 5.73 7 16 18.1 17.8 0.08 Earnings Per Share (EPS) 0.43 0.52 1.24 1.62 1.79 0.01 Efficiency Ratio's Asset Turnover 1.89 1.74 1.79 1.7 1.51 Inventory Turnover 12.1 6.4 7.4 6.6 5.3 5.4 Fixed Asset Turnover 3.5 3.5 4.3 49 5.3 5 Days Soles Outstanding 10.9 11.2 9.8 10.75 12 12.8 Days Inventory 30.11 57.3 49.4 55.6 69.3 67.3 25 225 30.3 29.4 Payable Period Cash Conversion Cycle Liquidity inancial Health Ratio's 15.6 25.4 25.4 54.7 43.5 36.7 36.1 52 Current Ratio 0.8 1.3 1.55 1.83 1.9 1.02 Quick Ratio 0.3 0.6 1 1.14 0.71 1.17 0.13 0.22 0.11 0.29 Debl/Equity Financial Leverage 0.18 1.83 0.15 1.74 2.28 1.68 1.61 2.57 Year on Your Growth Revenue Growth 10.3 -5.9 9.5 9.3 13.7 12 Source: All Financials used here are derived from Starbucks 10-K Form for Fiscal Years ended 2008, 2009, 2010, 2011, 2012, and 2013 Appendix 5: Starbucks Corporation's Financials Starbucks Corporation's Financials for Fiscal Year ending September of each year (All USD figures in millions) Key Ratio's/Accounts FY 2008 FY 2009 FY 2010 FY 2011 FY 2012 FY 2013 Profitability Ratio's 10.383 9.775 10,707 11,700 13.300 14,892 Revenue Gross Margin 19.2 55,8 58.4 57.7 56.3 57.1 504 562 1.419 1.729 1.997 -325 4.9 5.7 13.3 14.8 15 -2.2 Operating Income (USD Millions) Operating Income Morgin% Net Income (USD Milions) Net Margin 316 391 946 01.246 1,384 8 3 4 8.8 10.7 10.4 0.06 Return on Equity (ROE) % 13.2 14,1 28.14 30.9 292 0.17 Return on Assets (ROA) 5.73 7 16 18.1 17.8 0.08 Earnings Per Share (EPS) 0.43 0.52 1.24 1.62 1.79 0.01 Efficiency Ratio's Asset Turnover 1.89 1.74 1.79 1.7 1.51 Inventory Turnover 12.1 6.4 7.4 6.6 5.3 5.4 Fixed Asset Turnover 3.5 3.5 4.3 49 5.3 5 Days Soles Outstanding 10.9 11.2 9.8 10.75 12 12.8 Days Inventory 30.11 57.3 49.4 55.6 69.3 67.3 25 225 30.3 29.4 Payable Period Cash Conversion Cycle Liquidity inancial Health Ratio's 15.6 25.4 25.4 54.7 43.5 36.7 36.1 52 Current Ratio 0.8 1.3 1.55 1.83 1.9 1.02 Quick Ratio 0.3 0.6 1 1.14 0.71 1.17 0.13 0.22 0.11 0.29 Debl/Equity Financial Leverage 0.18 1.83 0.15 1.74 2.28 1.68 1.61 2.57 Year on Your Growth Revenue Growth 10.3 -5.9 9.5 9.3 13.7 12 Source: All Financials used here are derived from Starbucks 10-K Form for Fiscal Years ended 2008, 2009, 2010, 2011, 2012, and 2013
Step by Step Solution
There are 3 Steps involved in it

Get step-by-step solutions from verified subject matter experts