

Question: Create one chart in Excel that shows your ratio calculations for both companies. Use the template provided below. The first column lists the name of
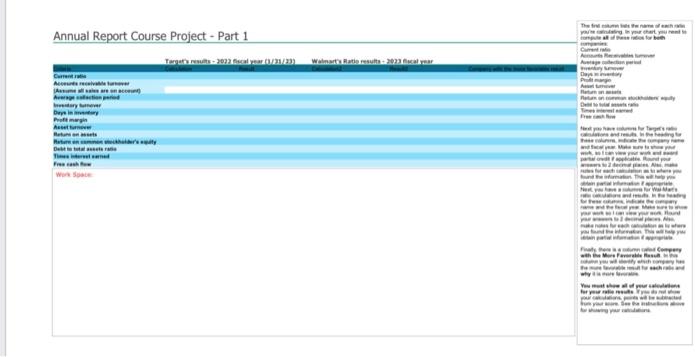
Create one chart in Excel that shows your ratio calculations for both companies. Use the template provided below.
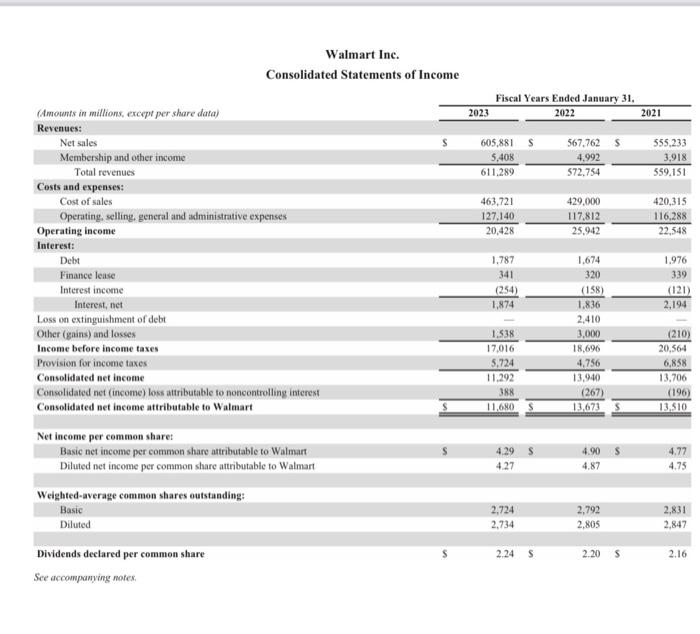
- The first column lists the name of each ratio youre calculating. In your chart, you need to compute all of these ratios for both companies:
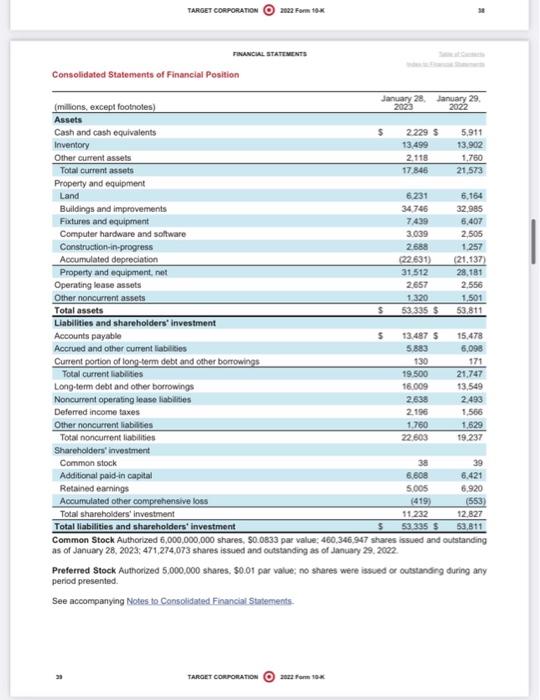
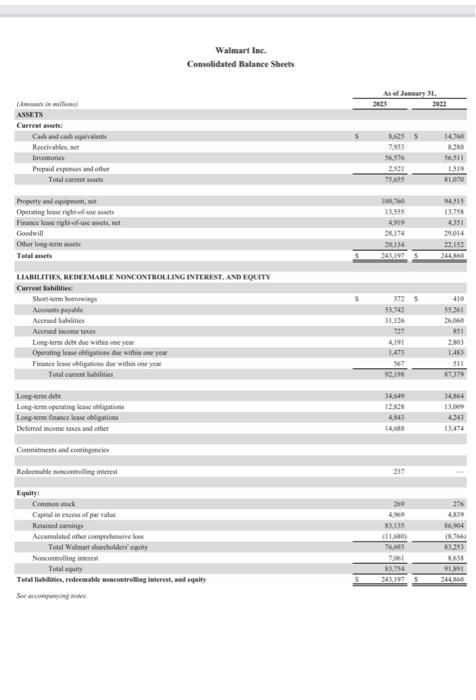
- Current ratio
- Accounts Receivables turnover - assume ALL sales are credit sales
- Average collection period
- Inventory turnover
- Days in inventory
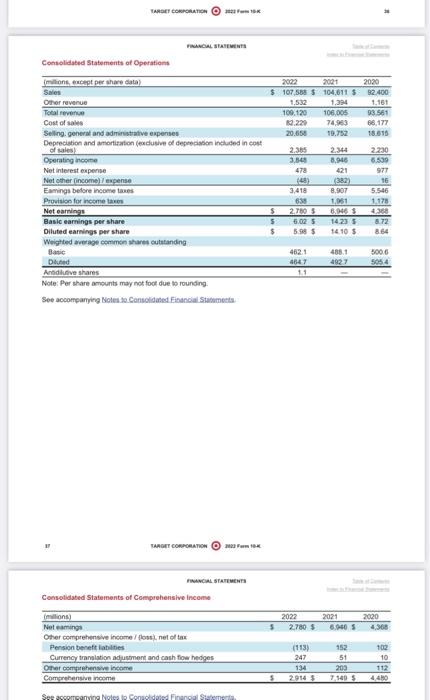
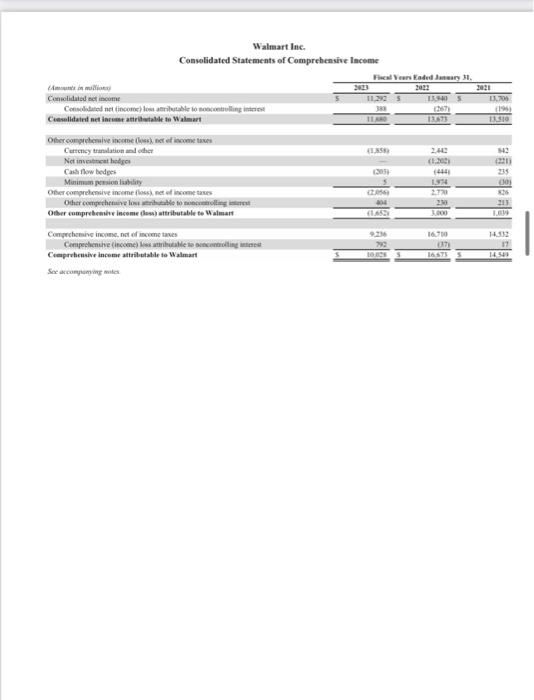
- Profit margin
- Asset turnover
- Return on assets
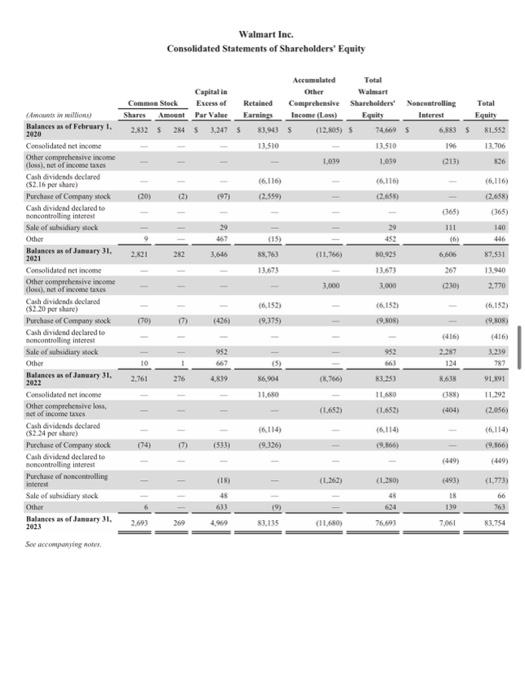
- Return on common stockholders equity
- Debt to total assets ratio
- Times interest earned
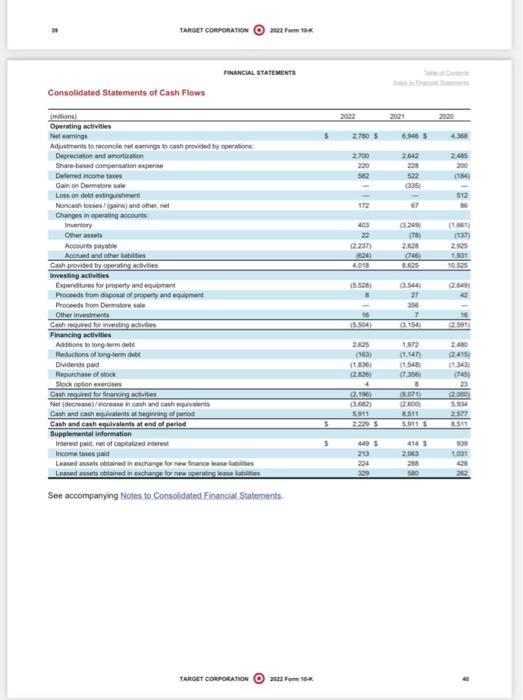
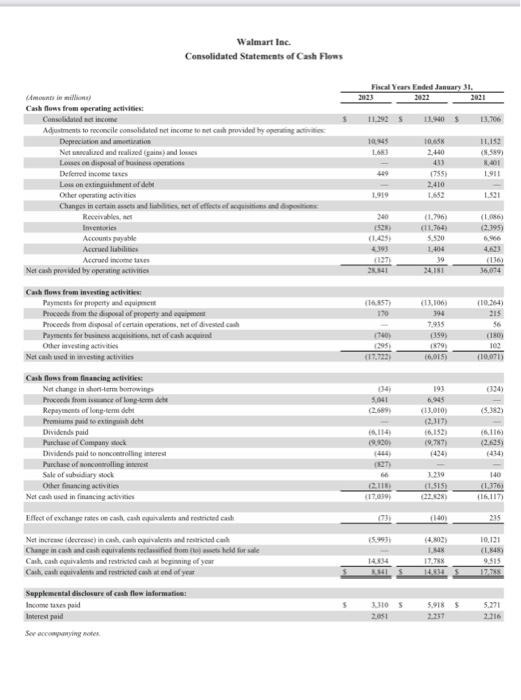
- Free cash flow
- You must use ratio formulas from the text.
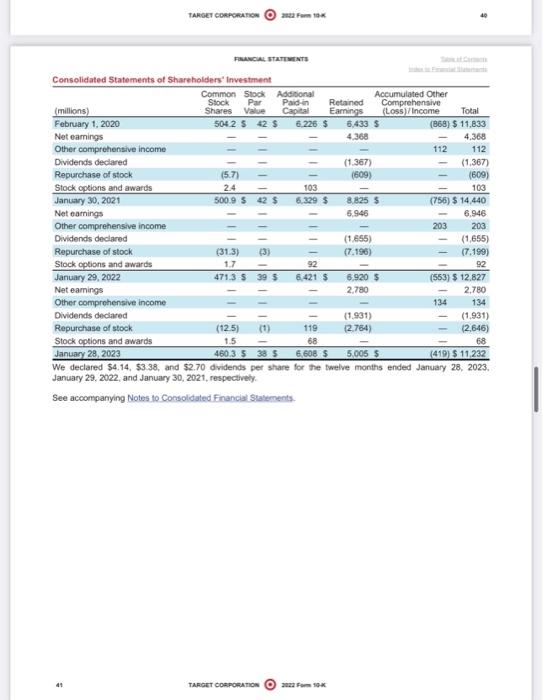
- Next you have columns for Targets ratio calculations and results. In the heading for these columns, indicate the company name and fiscal year. Make sure to show your work, so I can view your work and award partial credit if applicable. Round your answers to 2 decimal places. Also, make notes for each calculation as to where you found the information. This will help you obtain partial information if appropriate.
- Next, you have columns for Wal-Marts ratio calculations and results. In the heading for these columns, indicate the company name and the fiscal year. Make sure to show your work so I can view your work. Round your answers to 2 decimal places. Also, make notes for each calculation as to where you found the information. This will help you obtain partial information if appropriate.
- Finally, you have a column called Company with the More Favorable Result. In this column you will identify which company has the more favorable result for each ratio and why it is more favorable.
You must show all of your calculations for your ratio results. If you do not show your calculations, points will be subtracted from your score. See the instructions above for showing your calculations
Walmart Inc. Consolidated Statements of Cash Flows Annual Report Course Project - Part 1 Sir deccomperying nows. Walmart Inc. Consolidated Statements of Comprebensive laceme Walmart Ine. rasuicul statrutsts Consolidated Statements of Financial Posilion \begin{tabular}{|c|c|c|c|c|} \hline \multirow{2}{*}{Assets(millions,exceptfootnoles)} & \multicolumn{2}{|c|}{lanuary202328} & \multicolumn{2}{|c|}{\begin{tabular}{c} January 29 \\ 2022 \end{tabular}} \\ \hline & & & & \\ \hline Cash and cash equivalents & s & 2229 & $ & 5.911 \\ \hline Inventory & & 13.499 & & 13,902 \\ \hline Other current assets & & 2,118 & & 1,760 \\ \hline Total current assets & & 17,846 & & 21,573 \\ \hline \multicolumn{5}{|l|}{ Property and equipment } \\ \hline Land & & 6.231 & & 6,164 \\ \hline Buildings and improvements & & 34.746 & & 32.985 \\ \hline Foxtures and equipment & & 7,439 & & 6,407 \\ \hline Computer hardware and sofware & & 3.039 & & 2,505 \\ \hline Construction-in-progress & & 2.688 & & 1,257 \\ \hline Accumulated depreciation & & (22.631) & & (21,137) \\ \hline Properfy and equipment, net & & 31,512 & & 28,181 \\ \hline Operating loase assots & & 2.657 & & 2,556 \\ \hline Other noncurrent assets & & 1.320 & & 1,501 \\ \hline Total assets & $ & 53335 & & 53.811 \\ \hline \multicolumn{5}{|l|}{ Liabilities and shareholders' investment } \\ \hline Accounts payable & s & 13.487 & $ & 15,478 \\ \hline Accrued and other current liabilies & & & & 6,098 \\ \hline Current portion of long-tem debt and other borrowings & & 130 & & 171 \\ \hline Total current liabilates & & 19500 & & 21,747 \\ \hline Loag-tem debt and other barrowings & & 16.009 & & 13,549 \\ \hline Noncurrent operating lease liablities & & 2.638 & & 2.493 \\ \hline Deferred income taxes & & 2.196 & & 1,566 \\ \hline Other noncurrent liabilites & & 1.760 & & 1,629 \\ \hline Total noncurrent liabilities & & 22.603 & & 19.237 \\ \hline \multicolumn{5}{|l|}{ Shareholders' investment } \\ \hline Common stock & & 38 & & 39 \\ \hline Additional paid-in capital & & 6.608 & & 6.421 \\ \hline Retained earnings & & 5,005 & & 6.920 \\ \hline Accumulated other comprehensive loss & & (419) & & (553) \\ \hline Total shareholders' investment & & 11.232 & & 12,827 \\ \hline Total liabllities and shareholders' investment & 5 & 53335 & 5 & 53.811 \\ \hline \end{tabular} Common Stock Authorized 6,000,000,000 shares, \$0.0833 par value; 460,346,947 shares issued and oulstanding as of January 28, 2023; 471,274,073 shares issued and outstanding as of January 29, 2002. Preferred Stock Authorized 5,000,000 shates, \$0.01 par value; no shares were issued or outstanding during any period presented. See accompanying Notes to Consolidated Financial Statements. 23 Walmart Inc. Censolidated Statements of Shareholders' Equity see accompanyng crores 10 Consohasnea financas stavements. Takoer cokponance (O azafen tok Fancial statrorsts rawcuat sramentwrs Walmart Inc. Consolidated Statements of Cash Flows Annual Report Course Project - Part 1 Sir deccomperying nows. Walmart Inc. Consolidated Statements of Comprebensive laceme Walmart Ine. rasuicul statrutsts Consolidated Statements of Financial Posilion \begin{tabular}{|c|c|c|c|c|} \hline \multirow{2}{*}{Assets(millions,exceptfootnoles)} & \multicolumn{2}{|c|}{lanuary202328} & \multicolumn{2}{|c|}{\begin{tabular}{c} January 29 \\ 2022 \end{tabular}} \\ \hline & & & & \\ \hline Cash and cash equivalents & s & 2229 & $ & 5.911 \\ \hline Inventory & & 13.499 & & 13,902 \\ \hline Other current assets & & 2,118 & & 1,760 \\ \hline Total current assets & & 17,846 & & 21,573 \\ \hline \multicolumn{5}{|l|}{ Property and equipment } \\ \hline Land & & 6.231 & & 6,164 \\ \hline Buildings and improvements & & 34.746 & & 32.985 \\ \hline Foxtures and equipment & & 7,439 & & 6,407 \\ \hline Computer hardware and sofware & & 3.039 & & 2,505 \\ \hline Construction-in-progress & & 2.688 & & 1,257 \\ \hline Accumulated depreciation & & (22.631) & & (21,137) \\ \hline Properfy and equipment, net & & 31,512 & & 28,181 \\ \hline Operating loase assots & & 2.657 & & 2,556 \\ \hline Other noncurrent assets & & 1.320 & & 1,501 \\ \hline Total assets & $ & 53335 & & 53.811 \\ \hline \multicolumn{5}{|l|}{ Liabilities and shareholders' investment } \\ \hline Accounts payable & s & 13.487 & $ & 15,478 \\ \hline Accrued and other current liabilies & & & & 6,098 \\ \hline Current portion of long-tem debt and other borrowings & & 130 & & 171 \\ \hline Total current liabilates & & 19500 & & 21,747 \\ \hline Loag-tem debt and other barrowings & & 16.009 & & 13,549 \\ \hline Noncurrent operating lease liablities & & 2.638 & & 2.493 \\ \hline Deferred income taxes & & 2.196 & & 1,566 \\ \hline Other noncurrent liabilites & & 1.760 & & 1,629 \\ \hline Total noncurrent liabilities & & 22.603 & & 19.237 \\ \hline \multicolumn{5}{|l|}{ Shareholders' investment } \\ \hline Common stock & & 38 & & 39 \\ \hline Additional paid-in capital & & 6.608 & & 6.421 \\ \hline Retained earnings & & 5,005 & & 6.920 \\ \hline Accumulated other comprehensive loss & & (419) & & (553) \\ \hline Total shareholders' investment & & 11.232 & & 12,827 \\ \hline Total liabllities and shareholders' investment & 5 & 53335 & 5 & 53.811 \\ \hline \end{tabular} Common Stock Authorized 6,000,000,000 shares, \$0.0833 par value; 460,346,947 shares issued and oulstanding as of January 28, 2023; 471,274,073 shares issued and outstanding as of January 29, 2002. Preferred Stock Authorized 5,000,000 shates, \$0.01 par value; no shares were issued or outstanding during any period presented. See accompanying Notes to Consolidated Financial Statements. 23 Walmart Inc. Censolidated Statements of Shareholders' Equity see accompanyng crores 10 Consohasnea financas stavements. Takoer cokponance (O azafen tok Fancial statrorsts rawcuat sramentwrs
Step by Step Solution
There are 3 Steps involved in it

Get step-by-step solutions from verified subject matter experts