

Question: Create one chart in excel that shows your ratio calculations for both companies. Use the template provided. 1) The first column lists the name of

 here is the template we have to use.
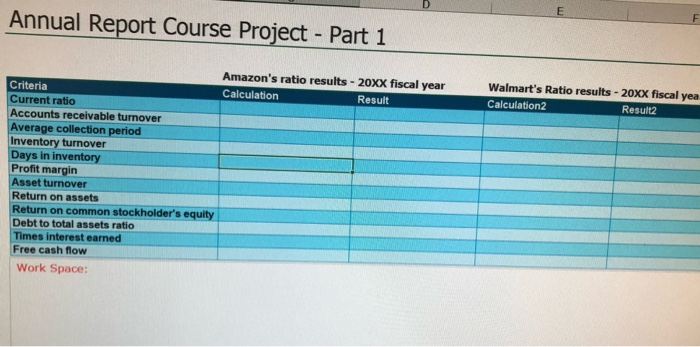
????
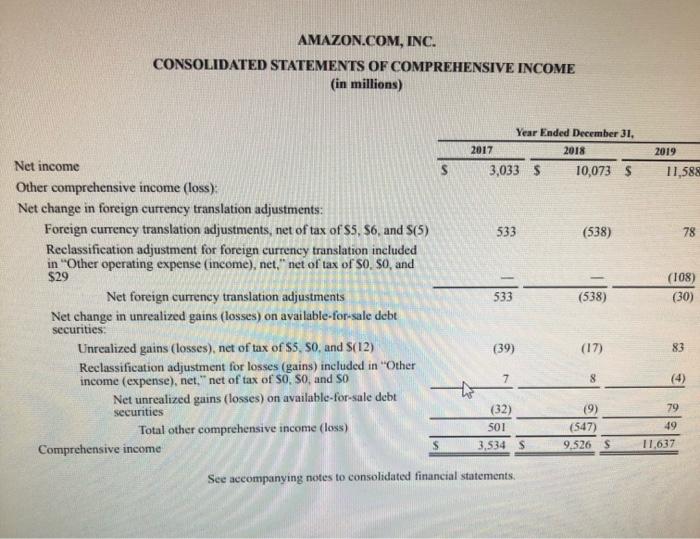
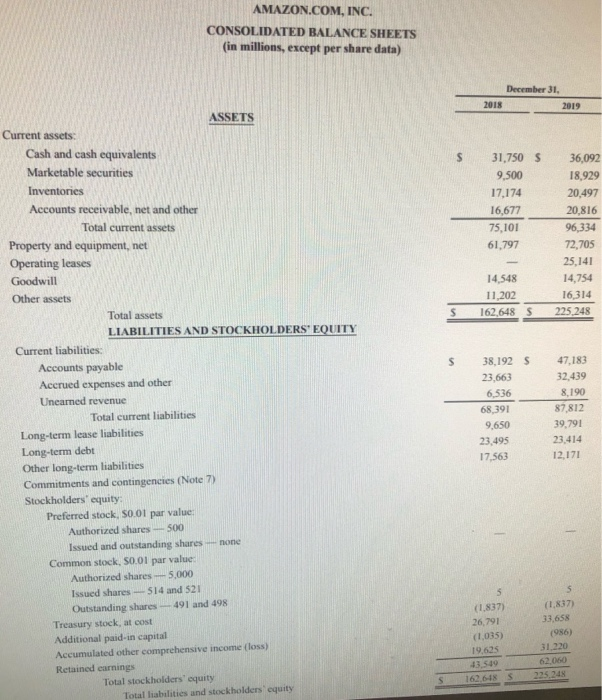
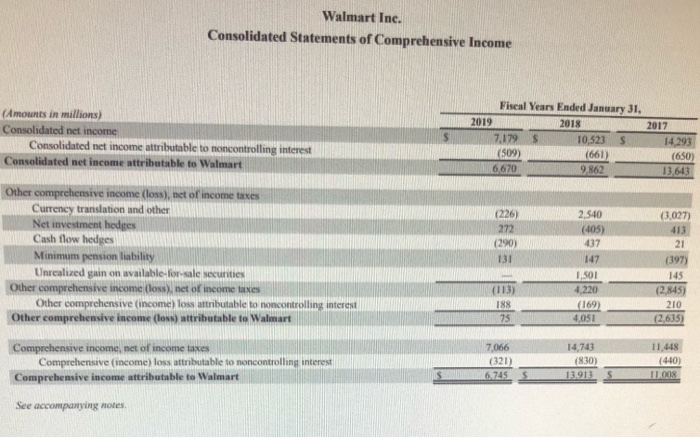
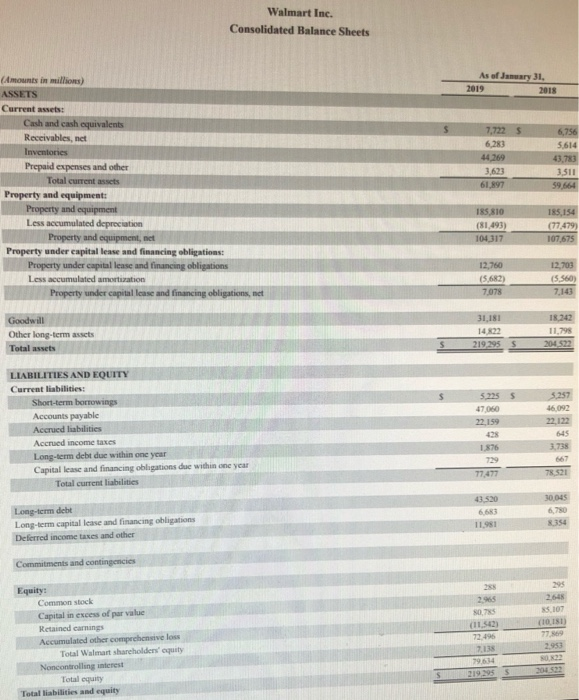
AMAZON.COM, INC. CONSOLIDATED STATEMENTS OF COMPREHENSIVE INCOME (in millions) Net income Other comprehensive income (loss): Net change in foreign currency translation adjustments: Foreign currency translation adjustments, net of tax of $5, $6, and S(5) Reclassification adjustment for foreign currency translation included in "Other operating expense (income), net," net of tax of 50, 50, and $29 Net foreign currency translation adjustments Net change in unrealized gains (losses) on available-for-sale debt securities: Unrealized gains (losses), net of tax of $5, 50, and S(12) Reclassification adjustment for losses (gains) included in "Other income (expense), net," net of tax of SO, SO, and 50 Net unrealized gains (losses) on available-for-sale debt securities Total other comprehensive income (loss) Comprehensive income S 2017 to 3,033 S 533 533 (39) Year Ended December 31, 7 (32) 501 3,534 S See accompanying notes to consolidated financial statements. 2018 10,073 S (538) (538) (17) 8 (9) (547) 9,526 S 2019 11,588 (108) (30) 78 83 (4) 79 49 11,637 Current assets: Cash and cash equivalents Marketable securities Inventories Accounts receivable, net and other Total current assets Property and equipment, net Operating leases Goodwill Other assets Current liabilities: Accounts payable Accrued expenses and other Unearned revenue Total assets LIABILITIES AND STOCKHOLDERS' EQUITY Total current liabilities Long-term lease liabilities Long-term debt Other long-term liabilities Preferred stock, $0.01 par value: Authorized shares- 500 AMAZON.COM, INC. CONSOLIDATED BALANCE SHEETS (in millions, except per share data) Commitments and contingencies (Note 7) Stockholders' equity: ASSETS Common stock, $0.01 par value: Authorized shares-5,000 Issued and outstanding shares-none Issued shares-514 and 521 Outstanding shares-491 and 498 Retained earnings Treasury stock, at cost Additional paid-in capital Accumulated other comprehensive income (loss) Total stockholders' equity Total liabilities and stockholders' equity S S S S 2018 December 31, 31,750 S 9,500 17,174 16,677 75,101 61,797 14,548 11,202 162,648 S 38,192 S 23,663 6,536 68,391 9,650 23,495 17,563 5 (1,837) 26,791 (1,035) 19.625 43.549 162,648 S 2019 36,092 18,929 20,497 20,816 96,334 72,705 25,141 14,754 16,314 225,248 47,183 32,439 8,190 87,812 39,791 23,414 12,171 (1,837) 33,658 (986) 31,220 62.060 225,248 Walmart Inc. Consolidated Statements of Comprehensive Income (Amounts in millions) Consolidated net income Consolidated net income attributable to noncontrolling interest Consolidated net income attributable to Walmart Other comprehensive income (loss), net of income taxes Currency translation and other Net investment hedges Cash flow hedges Minimum pension liability Unrealized gain on available-for-sale securities Other comprehensive income (loss), net of income taxes Other comprehensive (income) loss attributable to noncontrolling interest Other comprehensive income (loss) attributable to Walmart Comprehensive income, net of income taxes Comprehensive (income) loss attributable to noncontrolling interest Comprehensive income attributable to Walmart See accompanying notes. $ 2019 Fiscal Years Ended January 31, 2018 7,179 (509) 6,670 (226) 272 (290) 131 (113) 188 75 7,066 (321) 6.745 S S 10.523 (661) 9,862 2,540 (405) 437 147 1,501 4,220 (169) 4,051 14,743 (830) 13.913 S S 2017 14,293 (650) 13,643 (3,027) 413 21 (397) 145 (2,845) 210 (2,635) 11,448 (440) 11.008 (Amounts in millions) ASSETS Current assets: Cash and cash equivalents Receivables, net Inventories Prepaid expenses and other Total current assets Property and equipment: Property and equipment Less accumulated depreciation Property and equipment, net Property under capital lease and financing obligations: Property under capital lease and financing obligations Less accumulated amortization Goodwill Other long-term assets Total assets Property under capital lease and financing obligations, net LIABILITIES AND EQUITY Current liabilities: Short-term borrowings Accounts payable Accrued liabilities Accrued income taxes Long-term debt due within one year Capital lease and financing obligations due within one year Total current liabilities Long-term debt Long-term capital lease and financing obligations Deferred income taxes and other Commitments and contingencies Equity: Common stock Capital in excess of par value Retained earnings Walmart Inc. Consolidated Balance Sheets Accumulated other comprehensive loss Total Walmart shareholders' equity Noncontrolling interest Total equity Total liabilities and equity S $ S As of January 31, 2019 7,722 S 6,283 44,269 3,623 61,897 185,810 (81,493) 104,317 12,760 (5,682) 7,078 31,181 14,822 219,295 $ 5.225 S 47,060 22,159 428 1,876 729 77,477 43,520 6,683 11,981 288 2,965 80,785 (11,542) 72,496 7,138 79,634 219.295 S 2018 6,756 5,614 43,783 3,511 59,664 185,154 (77,479) 107,675 12,703 (5,560) 7,143 18,242 11,798 204,522 5,257 46,092 22,122 645 3.738 667 78.521 30,045 6,780 8.354 295 2.648 85,107 (10,181) 77,869 2.953 80,822 204.522 Review the company information in the Course Project Folder on the Learning Modules page. You will need this information to complete this part of the project. Create one chart in Excel that shows your ratio calculations for both companies. Use the template provided. 1) The first column lists the name of each ratio you're calculating. In your chart, you need to compute all of these ratios for both companies: Current ratio Accounts Receivables turnover Average collection period Inventory turnover Days in inventory Profit margin Asset turnover Return on assets Return on common stockholders' equity Debt to total assets ratio Times interest earned Free cash flow 2) Next you have columns for Amazon's ratio calculations and results. In the heading for these columns, indicate the company name and fiscal year. Make sure to show your work, so I can view your work and award partial credit if applicable. Round your answers to 2 decimal places. Also, make notes for each calculation as to where you found the information. This will help you obtain partial information if appropriate. 3) Next, you have columns for Wal-Mart's ratio calculations and results. In the heading for these columns, indicate the company name and the fiscal year. Make sure to show your work so I can view your work. Round your answers to 2 decimal places. Also, make notes for each calculation as to where you found the information. This will help you obtain partial information if appropriate. 4) Finally, you have a column called Company with the More Favorable Result. In this column you will for each salio Saumahla You rree cash HOW 2) Next you have columns for Amazon's ratio calculations and results. In the heading for these columns, indicate the company name and fiscal year. Make sure to show your work, so I can view your work and award partial credit if applicable. Round your answers to 2 decimal places. Also, make notes for each calculation as to where you found the information. This will help you obtain partial information if appropriate. 3) Next, you have columns for Wal-Mart's ratio calculations and results. In the heading for these columns indicate the company name and the fiscal year. Make sure to show your work so I can view your work. Round your answers to 2 decimal places. Also, mak notes for each calculation as to where you found the information. This will help you obtain partial information if appropriate. 4) Finally, you have a column called Company with the More Favorable Result. In this column you will identify which company has the more favorable result for each ratio and why it is more favorable. You must show all of your calculations for your ratio results. If you do not show your calculations, points will be fm our score See the instructions above for showing your calculations. Annual Report Course Project - Part 1 Criteria Current ratio Accounts receivable turnover Average collection period Inventory turnover Days in inventory Profit margin Asset turnover Return on assets Return on common stockholder's equity Debt to total assets ratio Times interest earned Free cash flow Work Space: D Amazon's ratio results - 20XX fiscal year Calculation Result E F Walmart's Ratio results - 20XX fiscal yea Calculation2 Result2
Step by Step Solution
3.48 Rating (155 Votes )
There are 3 Steps involved in it
Amazons ratio results 2019 fiscal year Walmart ratio results 2019 fiscal year Criteria Formula calcu... View full answer

Get step-by-step solutions from verified subject matter experts