

Question: Create one chart in Word or Excel that shows your ratio calculations for AMAZON. If youre using Word, type your detailed calculations, so I can
Create one chart in Word or Excel that shows your ratio calculations for AMAZON. If youre using Word, type your detailed calculations, so I can view your work. If youre using Excel, you should use formulas to calculate your results, so I can view your work. Round your answers to 2 decimal places. Also, make notes for each calculation as to where you found the information.
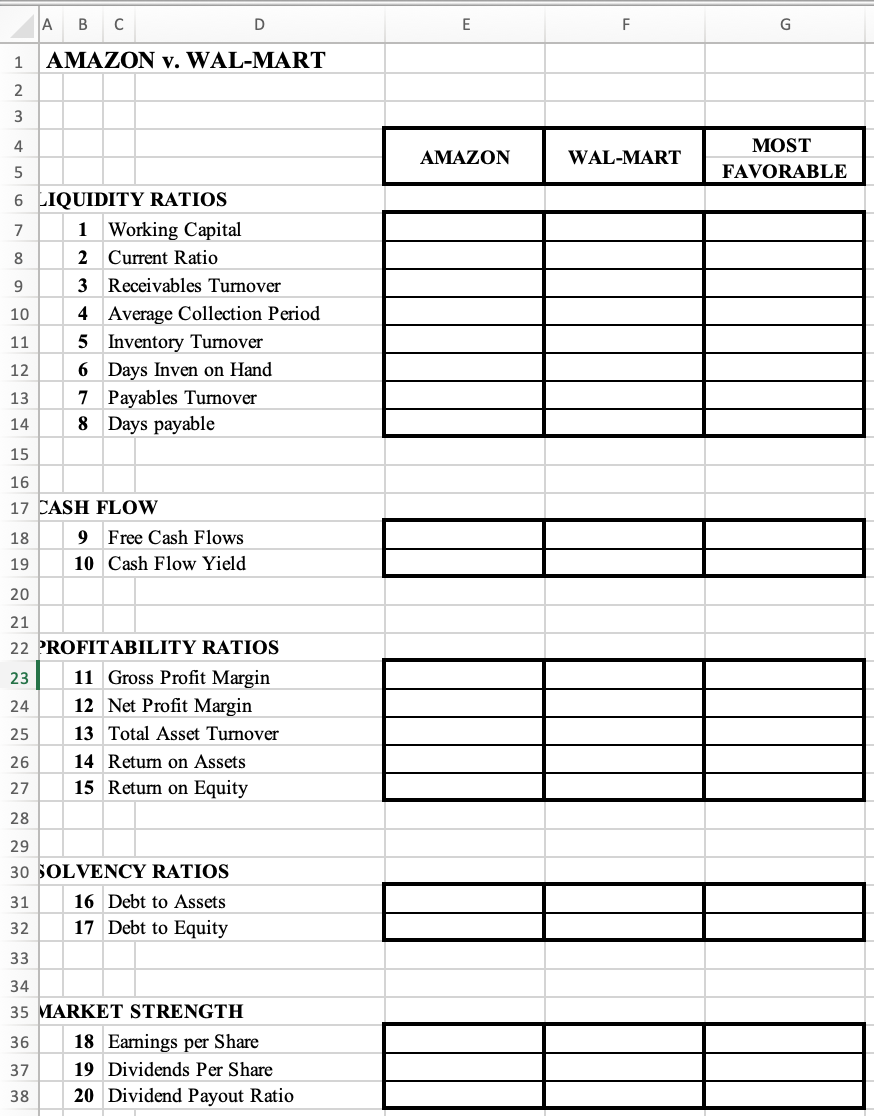
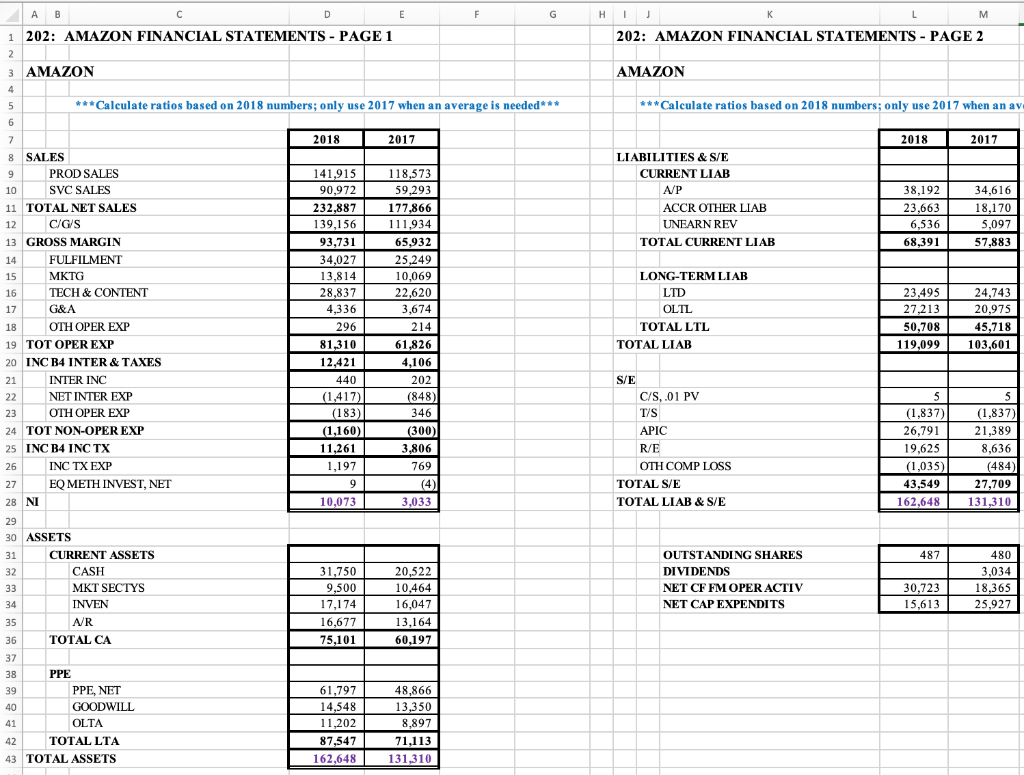
A B C D AMAZON v. WAL-MART AMAZON WAL-MART MOST FAVORABLE 9 11 13 6 LIQUIDITY RATIOS 1 Working Capital 2 Current Ratio 3 Receivables Turnover 4 Average Collection Period 5 Inventory Turnover 12 6 Days Inven on Hand 7 Payables Turnover 14 8 Days payable 15 16 17 CASH FLOW 9 Free Cash Flows 10 Cash Flow Yield 20 21 22 PROFITABILITY RATIOS 11 Gross Profit Margin 24 12 Net Profit Margin 13 Total Asset Turnover 26 14 Return on Assets 15 Return on Equity 25 27 29 30 SOLVENCY RATIOS 16 Debt to Assets 17 Debt to Equity 34 35 MARKET STRENGTH 18 Earnings per Share 19 Dividends Per Share 20 Dividend Payout Ratio AB 202: AMAZON FINANCIAL STATEMENTS - PAGE 1 L M 202: AMAZON FINANCIAL STATEMENTS - PAGE 2 1 AMAZON AMAZON ***Calculate ratios based on 2018 numbers; only use 2017 when an average is needed*** ***Calculate ratios based on 2018 numbers; only use 2017 when an av 2018 2017 2018 2017 LIABILITIES & S/E CURRENT LIAB A/P ACCR OTHER LIAB UNEARN REV TOTAL CURRENT LIAB 38,192 23,663 6,536 68,391 34,616 18,170 5,097 57,883 SALES PROD SALES 10 SVC SALES 11 TOTAL NET SALES C/G/S 13 GROSS MARGIN FULFILMENT MKTG TECH & CONTENT G&A OTH OPER EXP 19 TOT OPER EXP 20 INC B4 INTER & TAXES INTER INC NET INTER EXP OTH OPER EXP 24 TOT NON-OPER EXP 25 INC B4 INC TX 26 INC TX EXP EQ METH INVEST, NET 28 NI 141,915 90,972 232,887 139,156 93,731 34,027 13,814 28,837 4,336 296 81,310 12,421 440 (1,417)| (183) (1,160) 11,261 1,197 118,573 59,293 177,866 111,934 65,932 25,249 10,069 22,620 3,674 214 61,826 4,106 202 (848) 346 (300) 3,806 769 LONG-TERM LIAB LTD OLTL TOTAL LTL TOTAL LIAB 23,495 27,213 50,708 | 119,099 24,743 20,975 45,718 103.601 S/E C/S,.01 PV T/S APIC R/E OTH COMP LOSS TOTAL S/E TOTAL LIAB & S/E (1,837)| 26,791 1 19,625 (1,035) 43,549 162,648 (1,837) 21,389 8,636 (484) 27,709 131,310 10,073 3,033 4871 30 ASSETS CURRENT ASSETS CASH MKT SECTYS INVEN AR TOTAL CA 31,750 9,500 17,174 16,677 75,101 20,522 10.464 16,047 13,164 60,197 OUTSTANDING SHARES DIVIDENDS NET CF FM OPERACTIV NET CAP EXPENDITS 480 3,034 18,365 25,927 30,723 15,613 PPE PPE, NET GOODWILL OLTA TOTAL LTA 43 TOTAL ASSETS 61,797 48.866 14,548 13,350 11,2028 ,897 87,547 71,113 162,648 | 131,310
Step by Step Solution
There are 3 Steps involved in it

Get step-by-step solutions from verified subject matter experts