

Question: Create plots for die second-order control system, in the same figure, given by the following expression for different values of the damping ratio zeta, (zeta).
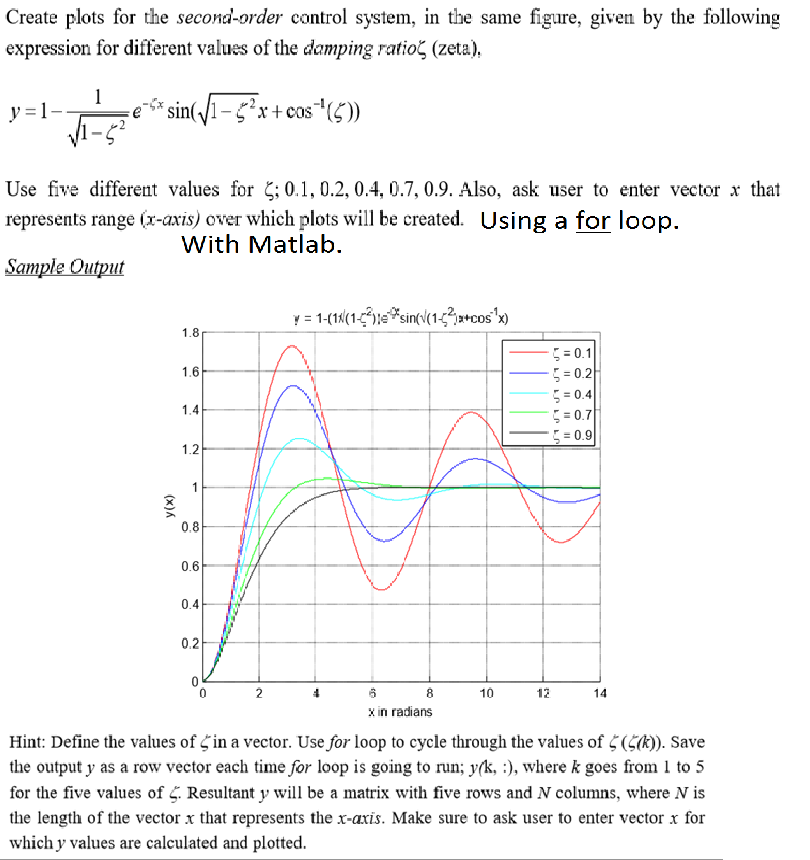
Create plots for die second-order control system, in the same figure, given by the following expression for different values of the damping ratio zeta, (zeta). y = 1 - 1/Squareroot 1 - zeta^2 e^-zero x sin(Squareroot 1 - zeta^1 x + cos^-1(zeta)) Use five different values for zeta, 0.1, 0.2, 0, 4, 0.7, 0.9. Also, ask user to enter vector x that represents range i. x-axis j over which plots will be created. Using a for loop. Create plots for die second-order control system, in the same figure, given by the following expression for different values of the damping ratio zeta, (zeta). y = 1 - 1/Squareroot 1 - zeta^2 e^-zero x sin(Squareroot 1 - zeta^1 x + cos^-1(zeta)) Use five different values for zeta, 0.1, 0.2, 0, 4, 0.7, 0.9. Also, ask user to enter vector x that represents range i. x-axis j over which plots will be created. Using a for loop
Step by Step Solution
There are 3 Steps involved in it

Get step-by-step solutions from verified subject matter experts