

Question: Create pro forma statement for the next 10 years. Consolidated Balance Sheets (unaudited) (in thousands) December 31, December 31, December 31, 2018 2016 2017 Assets
Create pro forma statement for the next 10 years.
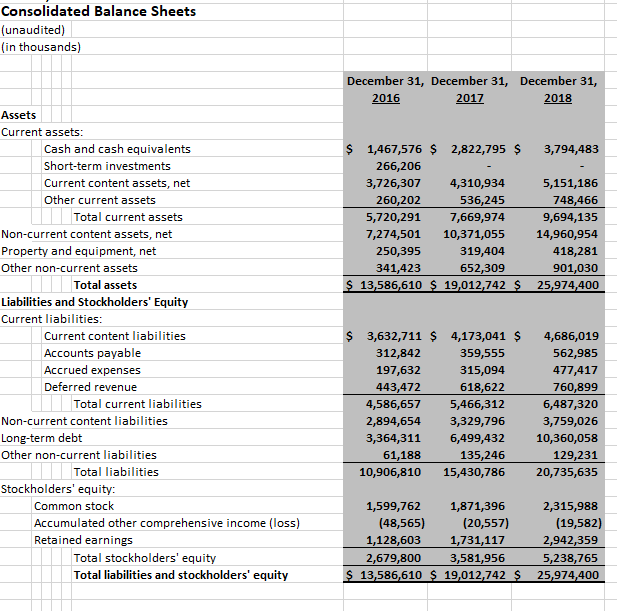
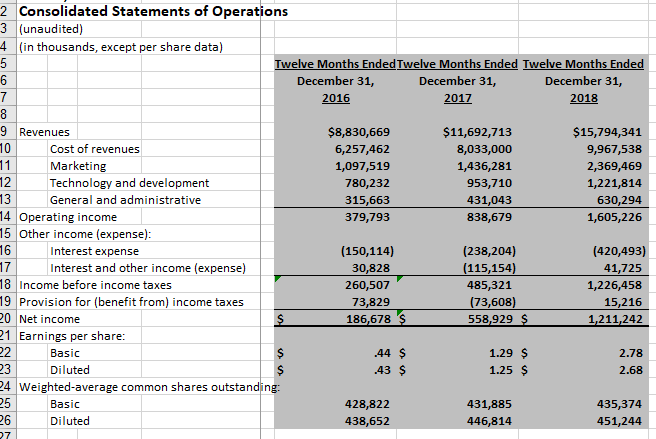
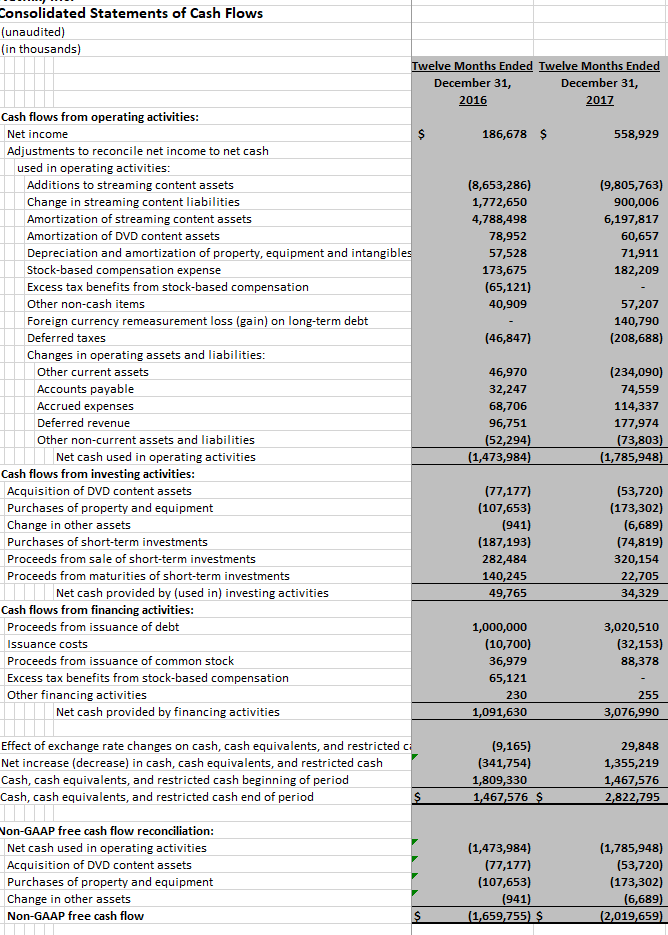
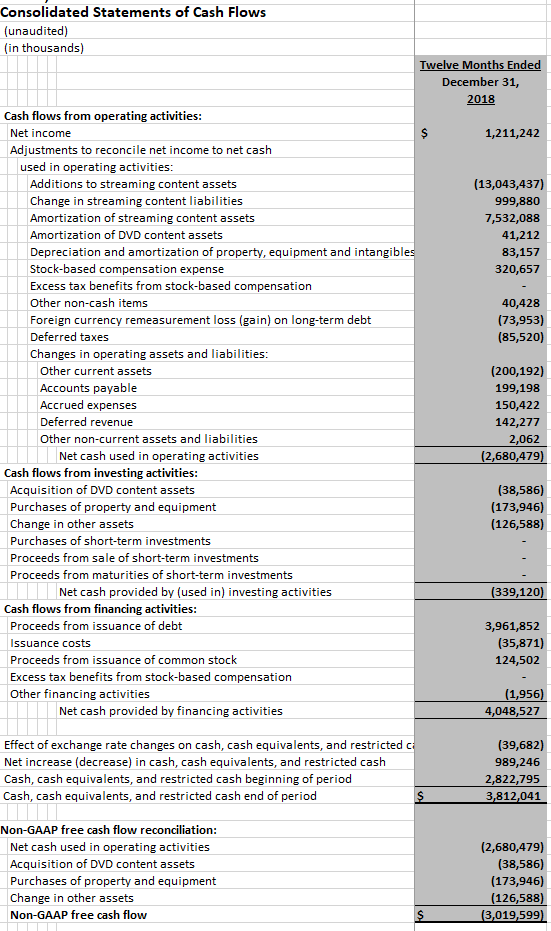
Consolidated Balance Sheets (unaudited) (in thousands) December 31, December 31, December 31, 2018 2016 2017 Assets Current assets Cash and cash equivalents Short-term investments Current content assets, net Other current assets $ 1,467,576 $ 2,822,795 $ 3,794,483 266,206 3,726,307 4,310,934 536,245 5,720,291 7,669,974 7,274,501 10,371,055 319,404 652,309 13,586,610 $ 19,012,742 5,151,186 748,466 9,694,135 14,960,954 418,281 901,030 25,974,400 260,202 Total current assets Non-current content assets, net Property and equipment, net Other non-current assets 250,395 341,423 Total assets Liabilities and Stockholders' Equity Current liabilities: Current content liabilities Accounts payable Accrued expenses Deferred revenu $ 3,632,711 $ 4,173,041 $ 4,686,019 562,985 477,417 760,899 6,487,320 3,759,026 3,364,311 6,499,432 10,360,058 129,231 20,735,635 359,555 315,094 618,622 4,586,657 5,466,312 2,894,654 3,329,796 312,842 197,632 443,472 Total current liabilities Non-current content liabilities Long-term debt Other non-current liabilities 61,188 135,246 10,906,810 15,430,786 Total liabilities Stockholders' equity: Common stock Accumulated other comprehensive income (loss) Retained earnings 1,599,762 1,871,396 (20,557) 1,731,117 3,581,956 13,586,610 $ 19,012,742 2,315,988 (19,582) 2,942,359 5,238,765 25,974,400 (48,565) 1,128,603 2,679,800 Total stockholders' equity Total liabilities and stockholders' equity 2 Consolidated Statements of Operations 3 (unaudited) 4in thousands, except per share data) Twelve Months Ended Twelve Months Ended Twelve Months End December 31, December 31, 2017 December 31, $11,692,713 $15,794,341 9,967,538 2,369,469 1,221,814 630,294 1,605,226 9 Revenues 10 $8,830,669 6,257,462 1,097,519 780,232 315,663 379,793 Cost of revenues Marketing Technology and development General and administrative 1,436,281 953,710 431,043 838,679 12 13 14 Operating income 15 Other income (expense): 16 17 18 Income before income taxes 19 Provision for (benefit from) income taxes 0 Net income 1 Earnings per share: (150,114) 30,828 260,507 73,829 186,678 (238,204) (115,154]) 485,321 73,608 (420,493) 41,725 1,226,458 15,216 1,211,242 Interest expense Interest and other income (expense) .44 $ 43 $ 1.29 $ 1.25 $ Basic Diluted 2.78 4 Weighted-average common shares outstanding: 431,885 446,814 Basic Diluted 428,822 438,652 435,374 451,244 26 27 onsolidated Statements of Cash Flows (unaudited) (in thousands) Twelve Months Ende December 31, 2016 December 31, 2017 Cash flows from operating activities 186,678 $ 558,929 Net income Adjustments to reconcile net income to net cash used in operating activities: Additions to streaming content assets Change in streaming content liabilities Amortization of streaming content assets Amortization of DVD content assets Depreciation and amortization of property, equipment and intangible Stock-based compensation expense Excess tax benefits from stock-based compensation Other non-cash items Foreign currency remeasurement loss (gain) on long-term debt Deferred taxes Changes in operating assets and liabilities: (8,653,286) 1,772,650 4,788,498 78,952 (9,805,763) 900,006 6,197,817 173,675 (65,121) 40,909 182,209 57,207 140,790 (208,688) (46,847) 46,970 68,706 Other current assets Accounts payable Accrued expenses Deterred revenue Other non-current assets and liabilities (234,090) 74,559 114,337 177,974 52,294 1,473,984 Net cash used in operating activities 1,785,948 Cash flows from investing activities: (53,720) (173,302) (6,689) Acquisition of DVD content assets Purchases of property and equipment Change in other assets Purchases of short-term investments Proceeds from sale of short-term investments Proceeds from maturities of short-term investments 17 (107,653) (187,193) 320,154 22,705 34,329 140,245 49,765 Net cash provided by (used in) investing activities Cash flows from financing activities 1,000,000 (10,700) 36,979 65,121 Proceeds from 1ssuance of debt Issuance costs Proceeds from issuance of common stock Excess tax benefits from stock-based compensation Other financing activities (32,153) Net cash provided by financing activities 3,076,990 Effect of exchange rate changes on cash, cash equivalents, and restricted c Net increase (decrease) in cash, cash equivalents, and restricted cash Cash, cash equivalents, and restricted cash beginning of period Cash, cash equivalents, and restricted cash end of period (9,165) (341,754) 1,809,330 1,467,576 29,848 1,355,219 1,467,576 2,822,795 on-GAAP free cash flow reconciliation: Net cash used in operating activities Acquisition of DVD content assets Purchases of property and equipment Change in other assets Non-GAAP free cash flow (1,785,948) (53,720) (173,302) (6,689) 2,019,659 (1,473,984) 17 (107,653) 1,659,755 Consolidated Statements of Cash Flows (unaudited) (in thousands) Months End December 31, 2018 Cash flows from operating activities Net income 1,211,242 Adjustments to reconcile net income to net cash used in operating activities: Additions to streaming content assets Change in streaming content liabilities Amortization of streaming content assets Amortization of DVD content assets Depreciation and amortization of property, equipment and intangible Stock-based compensation expense Excess tax benefits from stock-based compensation Other non-cash items Foreign currency remeasurement loss (gain) on long-term debt Deferred taxes Changes in operating assets and liabilities (13,043,437) 999,880 7,532,088 41,212 83,157 320,657 40,428 (73,953) (85,520) Other current assets Accounts payable Accrued expenses Deterred revenue Other non-current assets and liabilities (200,192) 199,198 150,422 142,277 2,062 2,680,479 Net cash used in operating activities Cash flows from investing activities: Acquisition of DVD content assets Purchases of property and equipment Change in other assets Purchases of short-term investments Proceeds from sale of short-term investments Proceeds from maturities of short-term investments (38,586) (173,946) (126,588) Net cash provided by (used in) investing activities (339,120) Cash flows from financing activities 3,961,852 (35,871) 124,502 Proceeds from 1ssuance of debt Issuance costs Proceeds from issuance of common stock Excess tax benefits from stock-based compensation Other financing activities 1,956 4,048,527 Net cash provided by financing activities Effect of exchange rate changes on cash, cash equivalents, and restricted c Net increase (decrease) in cash, cash equivalents, and restricted cash Cash, cash equivalents, and restricted cash beginning of period Cash, cash equivalents, and restricted cash end of period (39,682) 989,246 2,822,795 3,812,041 Non-GAAP free cash flow reconciliation: Net cash used in operating activities Acquisition of DVD content assets Purchases of property and equipment Change in other assets Non-GAAP free cash flow (2,680,479) (38,586) (173,946) (126,588) Consolidated Balance Sheets (unaudited) (in thousands) December 31, December 31, December 31, 2018 2016 2017 Assets Current assets Cash and cash equivalents Short-term investments Current content assets, net Other current assets $ 1,467,576 $ 2,822,795 $ 3,794,483 266,206 3,726,307 4,310,934 536,245 5,720,291 7,669,974 7,274,501 10,371,055 319,404 652,309 13,586,610 $ 19,012,742 5,151,186 748,466 9,694,135 14,960,954 418,281 901,030 25,974,400 260,202 Total current assets Non-current content assets, net Property and equipment, net Other non-current assets 250,395 341,423 Total assets Liabilities and Stockholders' Equity Current liabilities: Current content liabilities Accounts payable Accrued expenses Deferred revenu $ 3,632,711 $ 4,173,041 $ 4,686,019 562,985 477,417 760,899 6,487,320 3,759,026 3,364,311 6,499,432 10,360,058 129,231 20,735,635 359,555 315,094 618,622 4,586,657 5,466,312 2,894,654 3,329,796 312,842 197,632 443,472 Total current liabilities Non-current content liabilities Long-term debt Other non-current liabilities 61,188 135,246 10,906,810 15,430,786 Total liabilities Stockholders' equity: Common stock Accumulated other comprehensive income (loss) Retained earnings 1,599,762 1,871,396 (20,557) 1,731,117 3,581,956 13,586,610 $ 19,012,742 2,315,988 (19,582) 2,942,359 5,238,765 25,974,400 (48,565) 1,128,603 2,679,800 Total stockholders' equity Total liabilities and stockholders' equity 2 Consolidated Statements of Operations 3 (unaudited) 4in thousands, except per share data) Twelve Months Ended Twelve Months Ended Twelve Months End December 31, December 31, 2017 December 31, $11,692,713 $15,794,341 9,967,538 2,369,469 1,221,814 630,294 1,605,226 9 Revenues 10 $8,830,669 6,257,462 1,097,519 780,232 315,663 379,793 Cost of revenues Marketing Technology and development General and administrative 1,436,281 953,710 431,043 838,679 12 13 14 Operating income 15 Other income (expense): 16 17 18 Income before income taxes 19 Provision for (benefit from) income taxes 0 Net income 1 Earnings per share: (150,114) 30,828 260,507 73,829 186,678 (238,204) (115,154]) 485,321 73,608 (420,493) 41,725 1,226,458 15,216 1,211,242 Interest expense Interest and other income (expense) .44 $ 43 $ 1.29 $ 1.25 $ Basic Diluted 2.78 4 Weighted-average common shares outstanding: 431,885 446,814 Basic Diluted 428,822 438,652 435,374 451,244 26 27 onsolidated Statements of Cash Flows (unaudited) (in thousands) Twelve Months Ende December 31, 2016 December 31, 2017 Cash flows from operating activities 186,678 $ 558,929 Net income Adjustments to reconcile net income to net cash used in operating activities: Additions to streaming content assets Change in streaming content liabilities Amortization of streaming content assets Amortization of DVD content assets Depreciation and amortization of property, equipment and intangible Stock-based compensation expense Excess tax benefits from stock-based compensation Other non-cash items Foreign currency remeasurement loss (gain) on long-term debt Deferred taxes Changes in operating assets and liabilities: (8,653,286) 1,772,650 4,788,498 78,952 (9,805,763) 900,006 6,197,817 173,675 (65,121) 40,909 182,209 57,207 140,790 (208,688) (46,847) 46,970 68,706 Other current assets Accounts payable Accrued expenses Deterred revenue Other non-current assets and liabilities (234,090) 74,559 114,337 177,974 52,294 1,473,984 Net cash used in operating activities 1,785,948 Cash flows from investing activities: (53,720) (173,302) (6,689) Acquisition of DVD content assets Purchases of property and equipment Change in other assets Purchases of short-term investments Proceeds from sale of short-term investments Proceeds from maturities of short-term investments 17 (107,653) (187,193) 320,154 22,705 34,329 140,245 49,765 Net cash provided by (used in) investing activities Cash flows from financing activities 1,000,000 (10,700) 36,979 65,121 Proceeds from 1ssuance of debt Issuance costs Proceeds from issuance of common stock Excess tax benefits from stock-based compensation Other financing activities (32,153) Net cash provided by financing activities 3,076,990 Effect of exchange rate changes on cash, cash equivalents, and restricted c Net increase (decrease) in cash, cash equivalents, and restricted cash Cash, cash equivalents, and restricted cash beginning of period Cash, cash equivalents, and restricted cash end of period (9,165) (341,754) 1,809,330 1,467,576 29,848 1,355,219 1,467,576 2,822,795 on-GAAP free cash flow reconciliation: Net cash used in operating activities Acquisition of DVD content assets Purchases of property and equipment Change in other assets Non-GAAP free cash flow (1,785,948) (53,720) (173,302) (6,689) 2,019,659 (1,473,984) 17 (107,653) 1,659,755 Consolidated Statements of Cash Flows (unaudited) (in thousands) Months End December 31, 2018 Cash flows from operating activities Net income 1,211,242 Adjustments to reconcile net income to net cash used in operating activities: Additions to streaming content assets Change in streaming content liabilities Amortization of streaming content assets Amortization of DVD content assets Depreciation and amortization of property, equipment and intangible Stock-based compensation expense Excess tax benefits from stock-based compensation Other non-cash items Foreign currency remeasurement loss (gain) on long-term debt Deferred taxes Changes in operating assets and liabilities (13,043,437) 999,880 7,532,088 41,212 83,157 320,657 40,428 (73,953) (85,520) Other current assets Accounts payable Accrued expenses Deterred revenue Other non-current assets and liabilities (200,192) 199,198 150,422 142,277 2,062 2,680,479 Net cash used in operating activities Cash flows from investing activities: Acquisition of DVD content assets Purchases of property and equipment Change in other assets Purchases of short-term investments Proceeds from sale of short-term investments Proceeds from maturities of short-term investments (38,586) (173,946) (126,588) Net cash provided by (used in) investing activities (339,120) Cash flows from financing activities 3,961,852 (35,871) 124,502 Proceeds from 1ssuance of debt Issuance costs Proceeds from issuance of common stock Excess tax benefits from stock-based compensation Other financing activities 1,956 4,048,527 Net cash provided by financing activities Effect of exchange rate changes on cash, cash equivalents, and restricted c Net increase (decrease) in cash, cash equivalents, and restricted cash Cash, cash equivalents, and restricted cash beginning of period Cash, cash equivalents, and restricted cash end of period (39,682) 989,246 2,822,795 3,812,041 Non-GAAP free cash flow reconciliation: Net cash used in operating activities Acquisition of DVD content assets Purchases of property and equipment Change in other assets Non-GAAP free cash flow (2,680,479) (38,586) (173,946) (126,588)
Step by Step Solution
There are 3 Steps involved in it

Get step-by-step solutions from verified subject matter experts