

Question: Create program using answers below. How to create a vector x that consists of elements from range where elements increase with step = 0.1? How
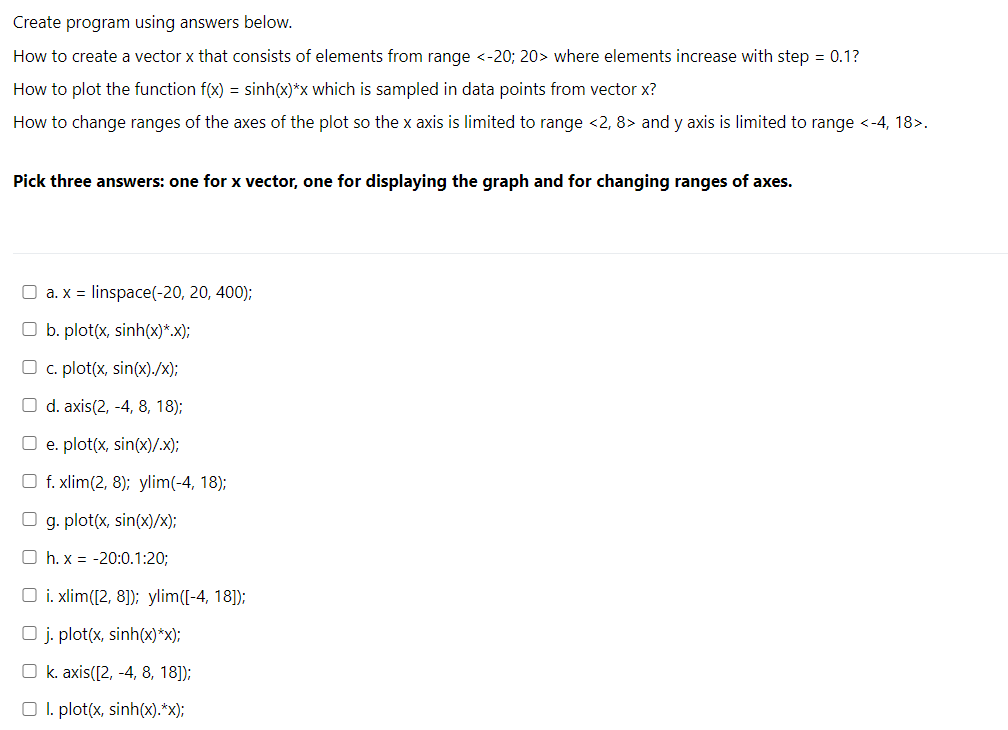
Create program using answers below. How to create a vector x that consists of elements from range where elements increase with step = 0.1? How to plot the function f(x) = sinh(x)*x which is sampled in data points from vector x? How to change ranges of the axes of the plot so the x axis is limited to range and y axis is limited to range . Pick three answers: one for x vector, one for displaying the graph and for changing ranges of axes. O a. x = linspace(-20, 20, 400); Ob.plot(x, sinh(x)*.x); O c.plot(x, sin(x)./x); O d. axis(2, -4, 8, 18); O e.plot(x, sin(x)/.x); Of. xlim (2,8); ylim(-4, 18); O g. plot(x, sin(x)/x); O h. x = -20:0.1:20; i. xlim([2, 8]); ylim((-4, 18]); O j.plot(x, sinh(x) *x); ok. axis([2, -4, 8, 18]); I.plot(x, sinh(x).*x)
Step by Step Solution
There are 3 Steps involved in it

Get step-by-step solutions from verified subject matter experts