

Question: Critical Thinking Challenges Sometimes a researcher must decide whether a variable is 2. Find the cumulative frequencies for each class, and normally distributed. There are
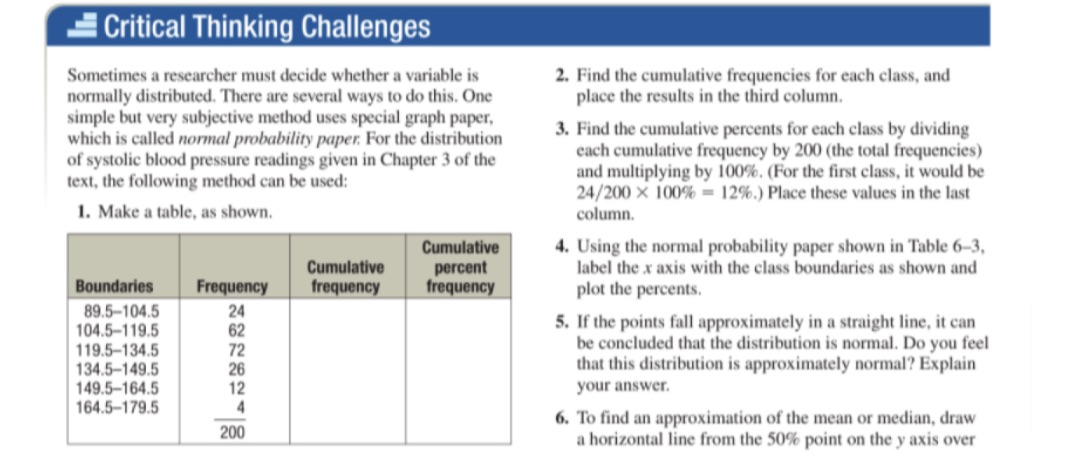
Critical Thinking Challenges Sometimes a researcher must decide whether a variable is 2. Find the cumulative frequencies for each class, and normally distributed. There are several ways to do this. One place the results in the third column. simple but very subjective method uses special graph paper, which is called normal probability paper. For the distribution 3. Find the cumulative percents for each class by dividing of systolic blood pressure readings given in Chapter 3 of the each cumulative frequency by 200 (the total frequencies) text, the following method can be used: and multiplying by 100%. (For the first class, it would be 24/200 X 100% = 12%.) Place these values in the last 1. Make a table, as shown. column. Cumulative 4. Using the normal probability paper shown in Table 6-3, Cumulative percent label the x axis with the class boundaries as shown and Boundaries Frequency frequency frequency plot the percents. 89.5-104.5 24 104.5-119.5 62 5. If the points fall approximately in a straight line, it can 119.5-134.5 72 be concluded that the distribution is normal. Do you feel 134.5-149.5 26 that this distribution is approximately normal? Explain 149.5-164.5 12 your answer. 164.5-179.5 6. To find an approximation of the mean or median, draw 200 a horizontal line from the 50% point on the y axis over
Step by Step Solution
There are 3 Steps involved in it

Get step-by-step solutions from verified subject matter experts