

Question: Sometimes a researcher must decide whether a variable is normally distributed. There are several ways to do this. One simple but very subjective method uses
Sometimes a researcher must decide whether a variable is normally distributed. There are several ways to do this. One simple but very subjective method uses special graph paper, which is called normal probability paper. For the distribution of systolic blood pressure readings given in Chapter 3 of the text, the following method can be used:
Make a table, as shown.
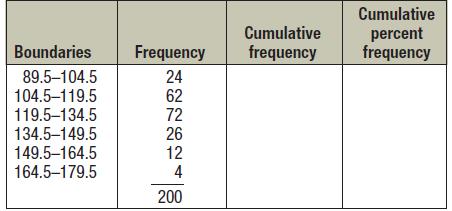
Boundaries Frequency 24 89.5-104.5 104.5-119.5 119.5-134.5 134.5-149.5 149.5-164.5 164.5-179.5 HOZG2A 62 72 26 12 4 200 Cumulative frequency Cumulative percent frequency
Step by Step Solution
3.41 Rating (164 Votes )
There are 3 Steps involved in it
ANSWER Boundaries Frequency Cumulative ... View full answer

Get step-by-step solutions from verified subject matter experts