

Question: Cross Section Analysis (compare with 2017) the yellow cells D E H B RATIO ANALYSIS FOR VALLEY COMPUTER LTD. Time Trend Analysis Cross Section ledustry
Cross Section Analysis (compare with 2017) the yellow cells
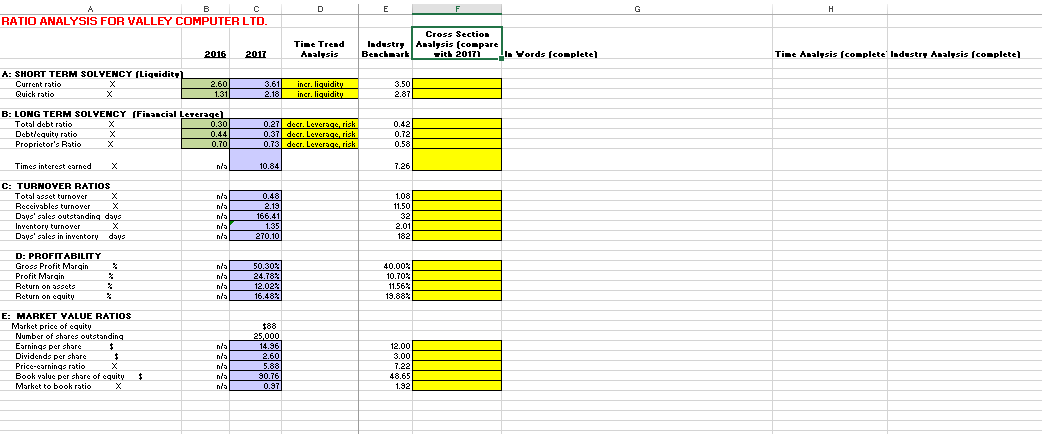
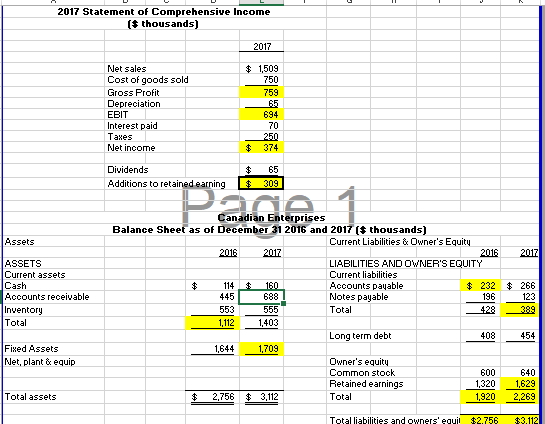
D E H B RATIO ANALYSIS FOR VALLEY COMPUTER LTD. Time Trend Analysis Cross Section ledustry Analysis (compare Benchmark ! Tith 20171 II. Yords (complete 2016 2017 Tine Analysis (complete ladustry Analysis (complete A: SHORT TERM SOLVENCY (Liquidity! Current ratio Quick ratio 2.60 1.31 3.61 incr. liquidity 2.18 incr. liquidity 3.50 2.87 B: LONG TERM SOLYENCY (Financial Leverage Total debt ratio 0.30 Debticquity ratio 0.44 Proprietor's Ratio 0.70 0.27 decr. Leverage risk 0.37 decr. Leverage, risk 0.73 decr. Leverage risk 0.42 0.72 0.58 Times interest carned 10.84 7.26 C: TURHOYER RATIOS Total asset turnover X Receivables turnover X Days' sales outstanding days Inventory turnover Days' sales in inventory days ndo nda n/s no 0.48 2.19 166.41 1.35 270.10 1.08 11.50 32 2.01 182 nie 3 D: PROFITABILITY Gross Profit Margin Profit Margin Return on assets Return on equity nda na nda % % 50.30% 24.78% 12.02% 16.48% 40.00% 10.70% 11.56% 19.88% E: HARKET YALUE RATIOS Market price of cquity Number of shares outstanding Earnings per share $ Dividends per share Price-carningo ratio X Book value per share of cquity Market to book ratio X nia nda nis nia nia 188 25.000 14.96 2.60 5.88 90.76 0.97 12.00 3.00 7.22 48.65 1.921 $ 2017 Statement of Comprehensive Income ($thousands) 2017 Net sales Cost of goods sold Gross Profit Depreciation EBIT Interest paid Taxes Net income $ 1,509 750 759 65 694 70 250 $ 374 Dividends Additions to retained earning $ $ 65 309 Assets ASSETS Current assets Cash Accounts receivable Inventory Total Canadian Enterprises Balance Sheet as of December 31 2016 and 2017 ( thousands) Current Liabilities & Owner's Equity 2016 2017 2016 2017 LIABILITIES AND OWNER'S EQUITY Current liabilities $ 114 $ 160 Accounts payable $ 232 $266 445 688 Notes payable 196 123 553 555 Total 428 389 1,112 1,403 Long term debt 408 454 1,644 1,709 Owner's equity Common stock 600 640 Retained earnings 1,320 1,629 $ 2,756 $ 3,112 Total 1.920 2.269 Fixed Assets Net, plant & equip Total assets Total liabilities and owners' equil $2.756 $3.112
Step by Step Solution
There are 3 Steps involved in it

Get step-by-step solutions from verified subject matter experts