

Question: ES Paste ID 3 A $% 88 Conditional Format Cell Formatting as Table Styles 9 Delete Format ZY Sort & Find & Fiter Select A10
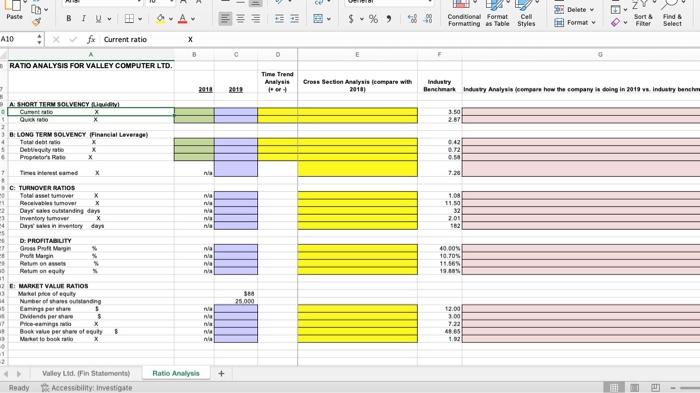
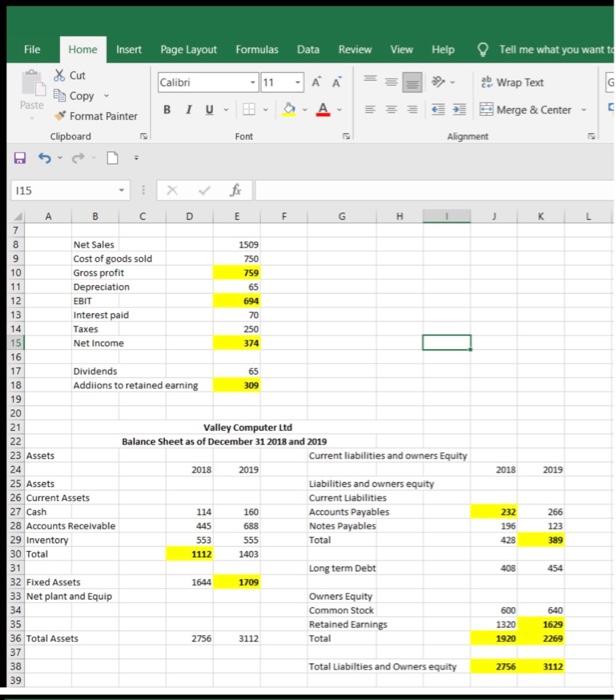
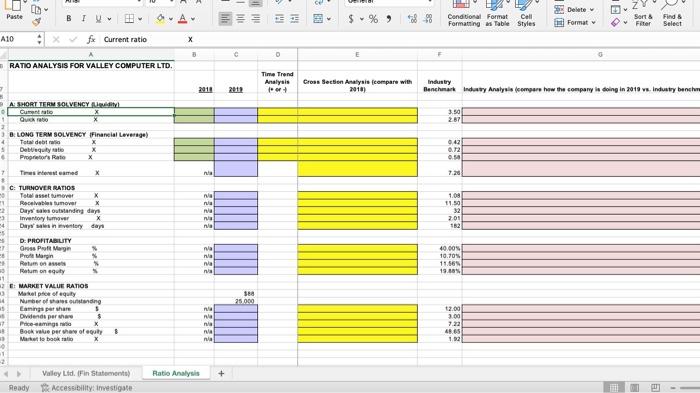
ES Paste ID 3 A $% 88 Conditional Format Cell Formatting as Table Styles 9 Delete Format ZY Sort & Find & Fiter Select A10 Xfx Current ratio A RATIO ANALYSIS FOR VALLEY COMPUTER LTD. Time Trend Analysis ++ 2011 Cross Section Analysis compare with 2018) Industry Benchmark Indary Analysis compare how the company is doing in 2018 vs. Industry bench 3.50 2.87 0.42 0.72 . 1.08 11.50 32 201 982 A: SHORT TERM SOLVENCY Adity Curatato QUERO BELONG TERM SOLVENCY Financial Laverage) Tot debrie 5 Debtequilate Protors Rate + X . C. TURNOVER RATIOS Total asset mot X wa Receivable uover x wa Day ottanding day na 3 Inventory X Daya invertory day na D: PROFITABILITY 7 Gross Pro Morgen wa Pro Marin nila Relum sa Retum nequity #1 B: MARKET VALUE RATOS Martel per el qully Number of song Enige pershare Dividends per 3 Pla Prime nia * Book value per than ototy Maral to book ratio X ni 1 2 Valley Ltd. (Fin Statement Ratio Analysis + Ready e Accessibility investigate 49.00 10.705 11.55 19.30 180 25 000 12.00 200 7.22 48.65 1.92 Formulas Data Review View Help Tell me what you want to - 11 G 10 File Home Insert Page Layout * Cut Calibri Copy Paste Format Painter BIU Clipboard 2 Wrap Text Merge & Center Alignment Font 115 f K B D E F G H 7 8 Net Sales 1509 9 Cost of goods sold 750 10 Gross profit 759 11 Depreciation 65 12 EBIT 694 13 interest paid 70 14 Taxes 250 15 Net Income 374 16 17 Dividends 65 18 Addiions to retained earning 309 19 20 21 Valley Computer Ltd 22 Balance Sheet as of December 31 2018 and 2019 23 Assets Current liabilities and owners Equity 24 2018 2019 25 Assets Liabilities and owners equity 26 Current Assets Current Liabilities 27 Cash 160 Accounts Payables 28 Accounts Receivable 445 688 Notes Payables 29 Inventory 553 Total 30 Total 1112 1403 31 Long term Debt 32 Fixed Assets 1644 1709 33 Net plant and Equip Owners Equity 34 Common Stock 35 Retained Earnings 36 Total Assets 2756 3112 Total 37 38 Total Liabilties and Owners equity 39 2018 2019 114 232 196 428 266 123 555 389 408 454 600 1320 1920 640 1629 2269 2756 3112 ce ID ZY Paste A $% 488 Conditional Format Cell Formatting as Table Styles 38 Delete Format Sort & Filter Find a Select A10 Xfx Current ratio A RATIO ANALYSIS FOR VALLEY COMPUTER LTD. 0 F Time Trend Analysis + 2011 Cross Section Analysis compare with 2018) Industry Benchmark Indary Analysis compare how the company is doing in 2018 vs Industry bench 3.50 2.87 A: SHORT TERM SOLVENCY Adity Current rato Qudrato BELONG TERM SOLVENCY Financial Loverage) Tot debrie Debequity rate Progre's Rate 042 0.72 . 7.28 + 1.09 11.50 32 201 152 wa na wa na -> wa wa C. TURNOVER RATIOS Total asset tover X Receivables tumover X Days outstanding day Inventory X Days in very day D: PROFITABILITY Gross Pro Morgan Marin Rotumas Rotum on equity MARKET VALUE RATOS Marsel for of equly Number of song Enige pershare Dividends per $ Pem Book value per than ototy Markete book ratio X 40.00 10.70% 11.56 13.00 #1 388 25 000 * nia 12.00 3.00 7.22 GROS 1.92 = na -1 Ratio Analysis + Valley Ltd. (Fin Statements) Ready Accessibility investigate
Step by Step Solution
There are 3 Steps involved in it

Get step-by-step solutions from verified subject matter experts