

Question: Cross State Trucking Brian Eagleton is a dispatch manager at Cross State Trucking, a major freight hauler based in Chicago, Illinois. Brian needs to develop
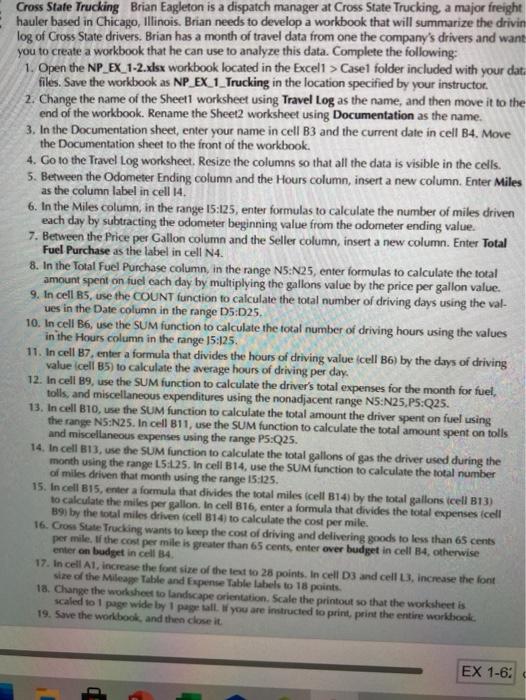
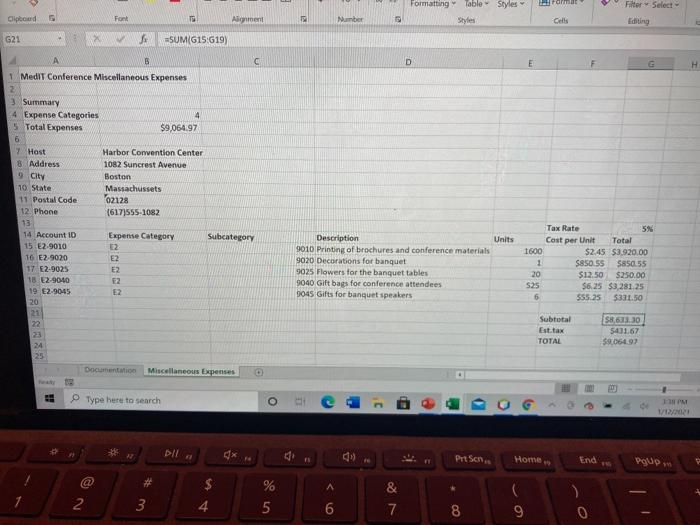
Cross State Trucking Brian Eagleton is a dispatch manager at Cross State Trucking, a major freight hauler based in Chicago, Illinois. Brian needs to develop a workbook that will summarize the drivin log of Cross State drivers. Brian has a month of travel data from one the company's drivers and want you to create a workbook that he can use to analyze this data. Complete the following: 1. Open the NP EX 1-2.xlsx workbook located in the Excell > Case folder included with your dat. files. Save the workbook as NP_EX_1_Trucking in the location specified by your instructor 2. Change the name of the Sheetl worksheet using Travel Log as the name, and then move it to the end of the workbook. Rename the Sheet2 worksheet using Documentation as the name. 3. In the Documentation sheet, enter your name in cell B3 and the current date in cell B4. Move the Documentation sheet to the front of the workbook. 4. Go to the Travel Log worksheet. Resize the columns so that all the data is visible in the cells. 5. Between the Odometer Ending column and the Hours column, insert a new column. Enter Miles as the column label in cell 14. 6. In the Miles column, in the range 15:125, enter formulas to calculate the number of miles driven each day by subtracting the odometer beginning value from the odometer ending value. 7. Between the Price per Gallon column and the Seller column, insert a new column. Enter Total Fuel Purchase as the label in cell N4. 8. In the Total Fuel Purchase column, in the range N5:N25, enter formulas to calculate the total amount spent on fuel each day by multiplying the gallons value by the price per gallon value. 9. In cell B5, use the COUNT function to calculate the total number of driving days using the val- ues in the Date column in the range 05:025. 10. In cell B6, use the SUM function to calculate the total number of driving hours using the values in the Hours column in the range 15:125. 11. In cell B7, enter a formula that divides the hours of driving value icell B6) by the days of driving value cell B5) to calculate the average hours of driving per day. 12. In cell 89, use the SUM function to calculate the driver's total expenses for the month for fuel, tolls, and miscellaneous expenditures using the nonadjacent range N5:N25.P5:Q25. 13. In cell B10, use the SUM function to calculate the total amount the driver spent on fuel using the range NS:N25. In cell B11, use the SUM function to calculate the total amount spent on tolls and miscellaneous expenses using the range P5:Q25. 14. In cell B13, use the SUM function to calculate the total gallons of gas the driver used during the month using the range 15:25. In cell B14, use the SUM function to calculate the total number of miles driven that month using the range 15:125. 15. In cell B15, enter a formula that divides the total miles (cell B14) by the total gallons cell 013) to calculate the miles per gallon. In cell B16, enter a formula that divides the total expenses cell 391 by the total miles driven cell 14 to calculate the cost per mile. 16. Cross State Trucking wants to keep the cost of driving and delivering goods to less than 65 cents per mile, the cost per mile is greater than 65 cents, enter over budget in cell B4, otherwise enter on budget in cell 34 17. In cell A1, increase the font size of the text to 25 points. In cell D3 and cell 3. Increase the font size of the Mileage Table and Expense Table Labels to 18 points 18. Change the worksheet to landscape orientation. Scale the printout so that the worksheet is scaled to page wide by 1 page all you are instructed to print, print the entire workbook. 19. Save the workbook, and then close it EX 1-6: Formatting Table Styles Format Filter Select Editing Clipboard Font Alignment Number Cells G21 =SUM(G15:619) B D 1 MediT Conference Miscellaneous Expenses 3 Summary 4 Expense Categories 4 5 Total Expenses $9,064.97 6 7 Host Harbor Convention Center 8 Address 1082 Suncrest Avenue 9 City Boston 10 State Massachussets 11 Postal Code 02128 12. Phone (617)555-1082 13 14 Account ID Expense Category 15 E2-9010 12 16 E2-9020 E2 17 E2-9025 E2 18 E2-90-10 E2 19 E2-9045 E2 20 21 22 Subcategory Description Units 9010 Printing of brochures and conference materials 9020 Decorations for banquet 9025 Flowers for the banquet tables 9040 Gift bags for conference attendees 9045 Gifts for banquet speakers 1800 1 20 S25 6 Tax Rate 5% Cost per Unit Total $2.45 $3.920,00 $850 55 $85055 $12.50 $250.00 $6.25 $3,281.25 $55.25 5331,50 Subtotal Est tax TOTAL 58,613.30 5401.67 59.064.97 24 Documentation Miscellaneous Expenses Type here to search 'M 1/ Dll x gi (9) Pit Sons Home gum a A 2 % 5 3 & 7 4 8 9 0 Cross State Trucking Brian Eagleton is a dispatch manager at Cross State Trucking, a major freight hauler based in Chicago, Illinois. Brian needs to develop a workbook that will summarize the drivin log of Cross State drivers. Brian has a month of travel data from one the company's drivers and want you to create a workbook that he can use to analyze this data. Complete the following: 1. Open the NP EX 1-2.xlsx workbook located in the Excell > Case folder included with your dat. files. Save the workbook as NP_EX_1_Trucking in the location specified by your instructor 2. Change the name of the Sheetl worksheet using Travel Log as the name, and then move it to the end of the workbook. Rename the Sheet2 worksheet using Documentation as the name. 3. In the Documentation sheet, enter your name in cell B3 and the current date in cell B4. Move the Documentation sheet to the front of the workbook. 4. Go to the Travel Log worksheet. Resize the columns so that all the data is visible in the cells. 5. Between the Odometer Ending column and the Hours column, insert a new column. Enter Miles as the column label in cell 14. 6. In the Miles column, in the range 15:125, enter formulas to calculate the number of miles driven each day by subtracting the odometer beginning value from the odometer ending value. 7. Between the Price per Gallon column and the Seller column, insert a new column. Enter Total Fuel Purchase as the label in cell N4. 8. In the Total Fuel Purchase column, in the range N5:N25, enter formulas to calculate the total amount spent on fuel each day by multiplying the gallons value by the price per gallon value. 9. In cell B5, use the COUNT function to calculate the total number of driving days using the val- ues in the Date column in the range 05:025. 10. In cell B6, use the SUM function to calculate the total number of driving hours using the values in the Hours column in the range 15:125. 11. In cell B7, enter a formula that divides the hours of driving value icell B6) by the days of driving value cell B5) to calculate the average hours of driving per day. 12. In cell 89, use the SUM function to calculate the driver's total expenses for the month for fuel, tolls, and miscellaneous expenditures using the nonadjacent range N5:N25.P5:Q25. 13. In cell B10, use the SUM function to calculate the total amount the driver spent on fuel using the range NS:N25. In cell B11, use the SUM function to calculate the total amount spent on tolls and miscellaneous expenses using the range P5:Q25. 14. In cell B13, use the SUM function to calculate the total gallons of gas the driver used during the month using the range 15:25. In cell B14, use the SUM function to calculate the total number of miles driven that month using the range 15:125. 15. In cell B15, enter a formula that divides the total miles (cell B14) by the total gallons cell 013) to calculate the miles per gallon. In cell B16, enter a formula that divides the total expenses cell 391 by the total miles driven cell 14 to calculate the cost per mile. 16. Cross State Trucking wants to keep the cost of driving and delivering goods to less than 65 cents per mile, the cost per mile is greater than 65 cents, enter over budget in cell B4, otherwise enter on budget in cell 34 17. In cell A1, increase the font size of the text to 25 points. In cell D3 and cell 3. Increase the font size of the Mileage Table and Expense Table Labels to 18 points 18. Change the worksheet to landscape orientation. Scale the printout so that the worksheet is scaled to page wide by 1 page all you are instructed to print, print the entire workbook. 19. Save the workbook, and then close it EX 1-6: Formatting Table Styles Format Filter Select Editing Clipboard Font Alignment Number Cells G21 =SUM(G15:619) B D 1 MediT Conference Miscellaneous Expenses 3 Summary 4 Expense Categories 4 5 Total Expenses $9,064.97 6 7 Host Harbor Convention Center 8 Address 1082 Suncrest Avenue 9 City Boston 10 State Massachussets 11 Postal Code 02128 12. Phone (617)555-1082 13 14 Account ID Expense Category 15 E2-9010 12 16 E2-9020 E2 17 E2-9025 E2 18 E2-90-10 E2 19 E2-9045 E2 20 21 22 Subcategory Description Units 9010 Printing of brochures and conference materials 9020 Decorations for banquet 9025 Flowers for the banquet tables 9040 Gift bags for conference attendees 9045 Gifts for banquet speakers 1800 1 20 S25 6 Tax Rate 5% Cost per Unit Total $2.45 $3.920,00 $850 55 $85055 $12.50 $250.00 $6.25 $3,281.25 $55.25 5331,50 Subtotal Est tax TOTAL 58,613.30 5401.67 59.064.97 24 Documentation Miscellaneous Expenses Type here to search 'M 1/ Dll x gi (9) Pit Sons Home gum a A 2 % 5 3 & 7 4 8 9 0
Step by Step Solution
There are 3 Steps involved in it

Get step-by-step solutions from verified subject matter experts