

Question: Cross Validation using: Validation Set Approach I need help creating a graph like this picture using Validation Set Approach. Below the picture is my R
Cross Validation using: Validation Set Approach
I need help creating a graph like this picture using Validation Set Approach. Below the picture is my R Script for Validation Set Approach. I just can't figure how to replicate the graph like that one. I am pretty sure I need to use plot(x, y, ...) and use the degrees of polynomials as the variable x and mean square error as y variables to plot the graph but I cannot figure out how to code it. Thank you in advance for your help and suggestions.
the data set can be used in R using the following command
install.packeges("ISLR")
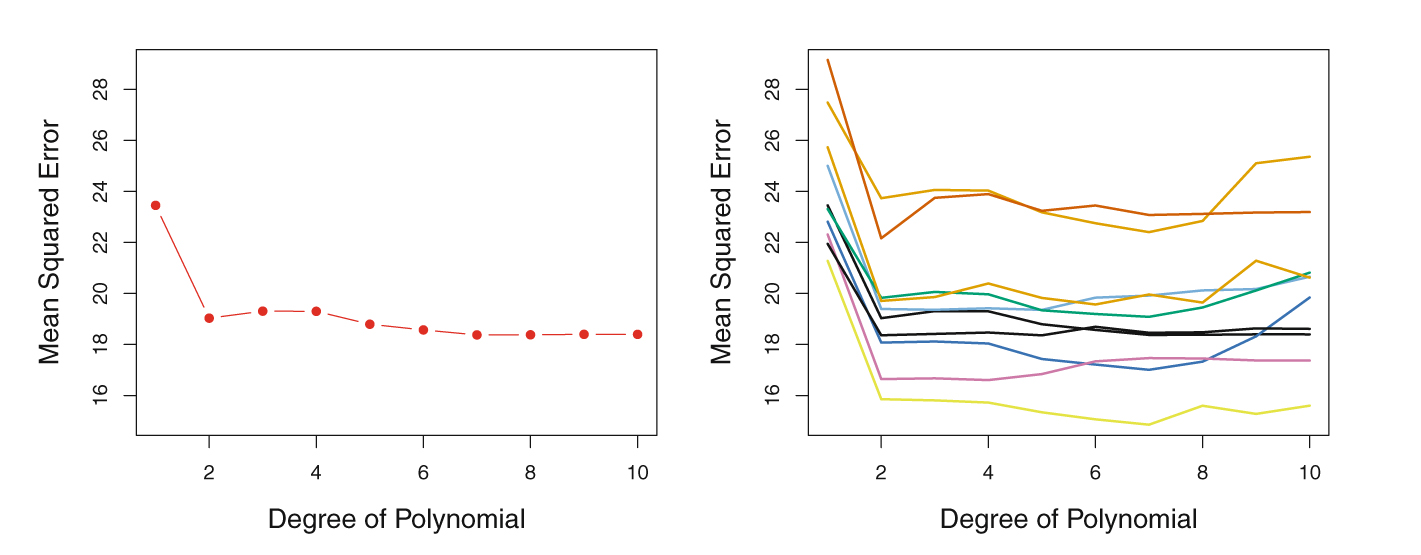
18 20 22 24 26 28 Mean Squared Error 16 18 20 22 24 26 28 Mean Squared Error Co 2 4 6 8 10 2 4 6 8 10 Degree of Polynomial Degree of Polynomial
Step by Step Solution
There are 3 Steps involved in it

Get step-by-step solutions from verified subject matter experts