

Question: Cross Validation using: Validation Set Approach I need help creating a graph like this picture using Validation Set Approach. Below the picture is my R
Cross Validation using: Validation Set Approach
I need help creating a graph like this picture using Validation Set Approach. Below the picture is my R Script for Validation Set Approach. I just can't figure how to replicate the graph like that one.
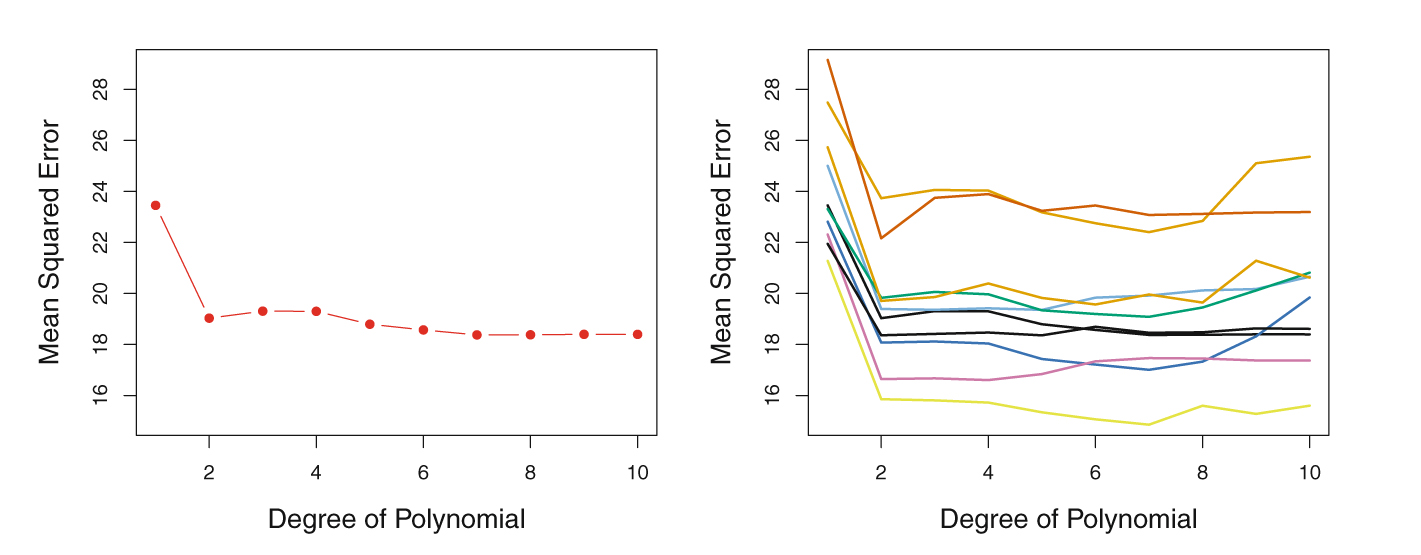
18 20 22 24 26 28 Mean Squared Error 16 18 20 22 24 26 28 Mean Squared Error Co 2 4 6 8 10 2 4 6 8 10 Degree of Polynomial Degree of Polynomial
Step by Step Solution
There are 3 Steps involved in it
1 Expert Approved Answer
Step: 1 Unlock

Question Has Been Solved by an Expert!
Get step-by-step solutions from verified subject matter experts
Step: 2 Unlock
Step: 3 Unlock