

Question: Cross-sectional analysis involves examining a company's financial data across account classifications. as percentages of net sales or total assets. and comparing it with other companies.
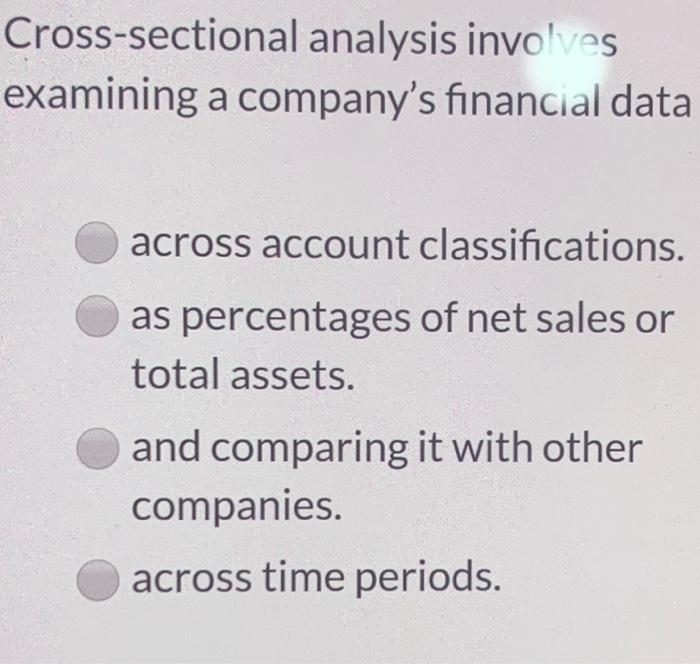
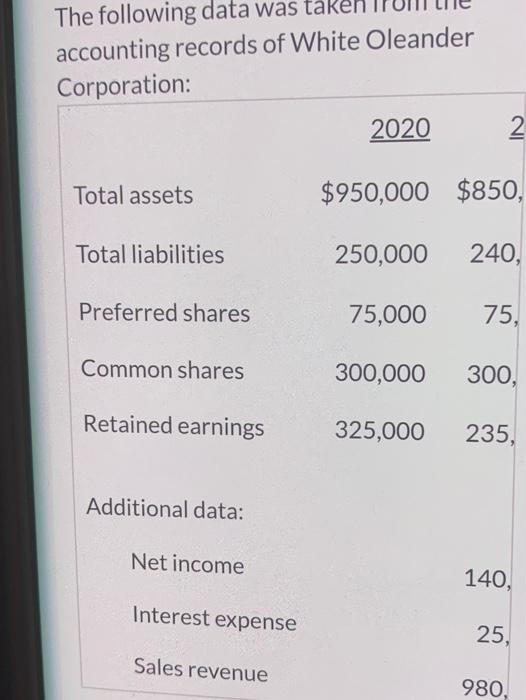
Cross-sectional analysis involves examining a company's financial data across account classifications. as percentages of net sales or total assets. and comparing it with other companies. across time periods. The following data was taken accounting records of White Oleander Corporation: 2020 IN Total assets $950,000 $850, Total liabilities 250,000 240, Preferred shares 75,000 75, Common shares 300,000 300, Retained earnings 325,000 235, Additional data: Net income 140, Interest expense 25, Sales revenue 980, Cross-sectional analysis involves examining a company's financial data across account classifications. as percentages of net sales or total assets. and comparing it with other companies. across time periods. The following data was taken accounting records of White Oleander Corporation: 2020 IN Total assets $950,000 $850, Total liabilities 250,000 240, Preferred shares 75,000 75, Common shares 300,000 300, Retained earnings 325,000 235, Additional data: Net income 140, Interest expense 25, Sales revenue 980
Step by Step Solution
There are 3 Steps involved in it

Get step-by-step solutions from verified subject matter experts