

Question: CSL Ltd (CSL.AX) All numbers except for ratios and EPS are in thousands ('000's) Report Date 30/06/2020 30/06/2019 30/06/2018 30/06/2017 30/06/2016 30/06/2015 Income Statement Revenues
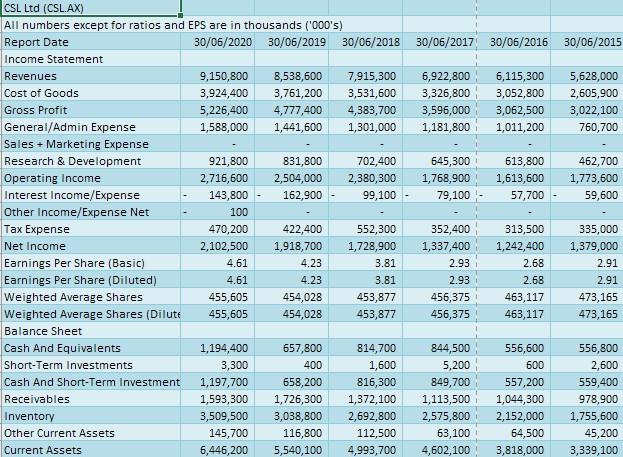
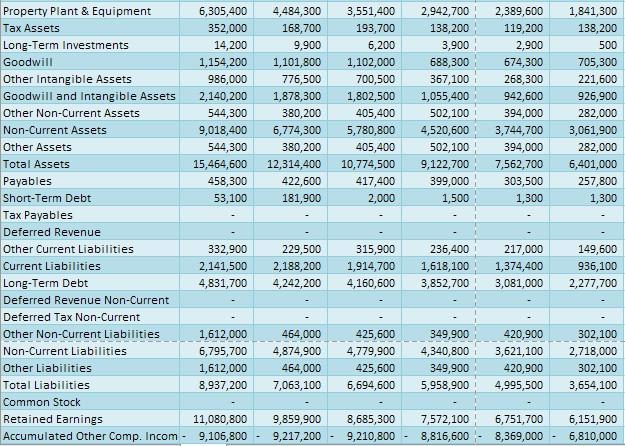
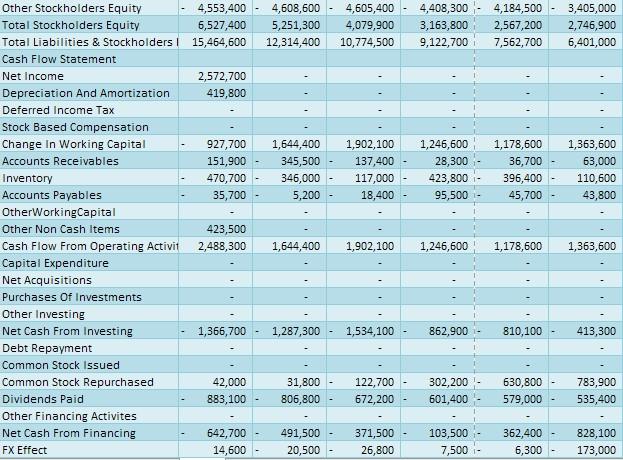

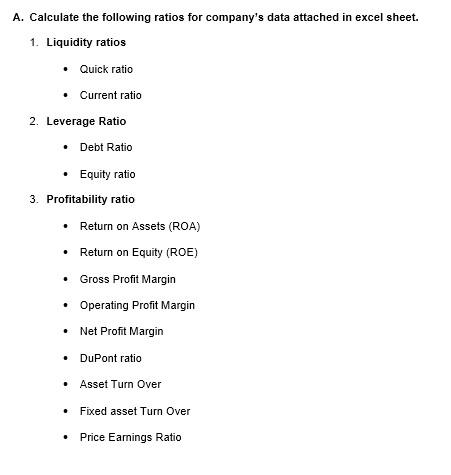
CSL Ltd (CSL.AX) All numbers except for ratios and EPS are in thousands ('000's) Report Date 30/06/2020 30/06/2019 30/06/2018 30/06/2017 30/06/2016 30/06/2015 Income Statement Revenues 9,150,800 8,538,600 7,915,300 6,922,800 6,115,300 5,628,000 Cost of Goods 3,924,400 3,761,200 3,531,600 3,326,800 3,052,800 2,605,900 Gross Profit 5,226,400 4,777,400 4,383,700 3,596,000 3,062,500 3,022,100 General/Admin Expense 1,588,000 1,441,600 1,301,000 1,181,800 1,011,200 760,700 Sales + Marketing Expense Research & Development 921,800 831,800 702,400 645,300 613,800 462,700 Operating Income 2,716,600 2,504,000 2,380,300 1,768,900 1,613,600 1,773,600 Interest Income/Expense 143,800 162,900 99,100 79,100 57,700 59,600 Other Income/Expense Net 100 Tax Expense 470,200 422,400 552,300 352,400 313,500 335,000 Net Income 2,102,500 1,918,700 1,728,900 1,337,400 1,242,400 1,379,000 Earnings Per Share (Basic) 4.61 4.23 3.81 2.93 2.68 2.91 Earnings Per Share (Diluted) 4.61 4.23 3.81 2.93 2.68 2.91 Weighted Average Shares 455,605 454,028 453,877 456,375 463,117 473,165 Weighted Average Shares (Dilute 455,605 454,028 453,877 456,375 463,117 473,165 Balance Sheet Cash And Equivalents 1,194,400 657,800 814,700 844,500 556,600 556,800 Short-Term Investments 3,300 400 1,600 5,200 600 2,600 Cash And Short-Term Investment 1,197,700 658,200 816,300 849,700 557,200 559,400 Receivables 1,593,300 1,726,300 1,372,100 1,113,500 1,044,300 978,900 Inventory 3,509,500 3,038,800 2,692,800 2,575,800 2,152,000 1,755,600 Other Current Assets 145,700 116,800 112,500 63,100 64,500 45,200 Current Assets 6,446,200 5,540,100 4,993,700 4,602,100 3,818,000 3,339,100 1,841,300 138,200 500 705,300 221,600 926,900 282,000 3,061,900 282,000 6,401,000 257,800 1,300 Property Plant & Equipment 6,305,400 4,484,300 3,551,400 2,942,700 2,389,600 Tax Assets 352,000 168,700 193,700 138,200 119,200 Long-Term Investments 14,200 9,900 6,200 3,900 2,900 Goodwill 1,154,200 1,101,800 1,102,000 688,300 674,300 Other Intangible Assets 986,000 776,500 700,500 367,100 268,300 Goodwill and Intangible Assets 2,140,200 1,878,300 1,802,500 1,055,400 942,600 Other Non-Current Assets 544,300 380,200 405,400 502,100 394,000 Non-Current Assets 9,018,400 6,774,300 5,780,800 4,520,600 3,744,700 Other Assets 544,300 380,200 405,400 502,100 394,000 Total Assets 15,464,600 12,314,400 10,774,500 9,122,700 7,562,700 Payables 458,300 422,600 417,400 399,000 303,500 Short-Term Debt 53,100 181,900 2,000 1,500 1,300 Tax Payables Deferred Revenue Other Current Liabilities 332,900 229,500 315,900 236,400 217,000 Current Liabilities 2,141,500 2,188,200 1,914,700 1,618,100 1,374,400 Long-Term Debt 4,831,700 4,242,200 4,160,600 3,852,700 3,081,000 Deferred Revenue Non-Current Deferred Tax Non-Current Other Non-Current Liabilities 1,612,000 464,000 425,600 349,900 420,900 Non-Current Liabilities 6,795,700 4,874,900 4,779,900 4,340,800 3,621,100 Other Liabilities 1,612,000 464,000 425,600 349,900 420,900 Total Liabilities 8,937,200 7,063,100 6,694,600 5,958,900 4,995,500 Common Stock Retained Earnings 11,080,800 9,859,900 8,685,300 7,572,100 6,751,700 Accumulated Other Comp. Incom - 9,106,800 - 9,217,200 9,210,800 - 8,816,600 - 8,369,000 149,600 936,100 2,277,700 302,100 2,718,000 302,100 3,654,100 6,151,900 6,810,000 4,608,600 5,251,300 12,314,400 4,605,400 4,079,900 10,774,500 4,408,300 3,163,800 9,122,700 4,184,500 2,567,200 7,562,700 3,405,000 2,746,900 6,401,000 1,644,400 345,500 346,000 5,200 1,902,100 137,400 117,000 18,400 - 1,246,600 28,300 423,800 95,500 1,178,600 36,700 396,400 45,700 1,363,600 63,000 110,600 43,800 Other Stockholders Equity 4,553,400 Total Stockholders Equity 6,527,400 Total Liabilities & Stockholders! 15,464,600 Cash Flow Statement Net Income 2,572,700 Depreciation And Amortization 419,800 Deferred Income Tax Stock Based Compensation Change in Working Capital 927,700 Accounts Receivables 151,900 Inventory 470,700 Accounts Payables 35,700 - OtherWorkingCapital Other Non Cash Items 423,500 Cash Flow From Operating Activit 2,488,300 Capital Expenditure Net Acquisitions Purchases of Investments Other Investing Net Cash From Investing 1,366,700 Debt Repayment Common Stock Issued Common Stock Repurchased 42,000 Dividends Paid 883,100 Other Financing Activites Net Cash From Financing 642,700 FX Effect 14,600 1,644,400 1,902,100 1,246,600 1,178,600 1,363,600 1,287,300 1,534,100 862,900 810,100 413,300 -- 31,800 806,800 122,700 672,200 302,200 601,400 630,800 579,000 783,900 535,400 491,500 20,500 371,500 26,800 103,500 7,500 362,400 6,300 828,100 173,000 Net Change In Cash Cash At End Of Period Cash At Start Of Period 493,500 1,151,300 657,800 154,900 659,800 814,700 30,300 814,200 844,500 287,700 844,300 556,600 200 556,600 556,800 50,800 558,200 609,000 A. Calculate the following ratios for company's data attached in excel sheet. 1. Liquidity ratios Quick ratio Current ratio 2. Leverage Ratio Debt Ratio Equity ratio 3. Profitability ratio Return on Assets (ROA) Return on Equity (ROE) Gross Profit Margin Operating Profit Margin Net Profit Margin DuPont ratio Asset Turn Over Fixed asset Turn Over Price Earnings Ratio B. Conduct the following analysis based on data attached in excel sheet Horizontal analysis, select one base year 2015, and calculate dollar change and percentage change. Vertical analysis (Common size analysis) Trend analysis, select base year 2015 for trend analysis C. Important: Write a report to analyze ratios calculated with proper interpretation in part (A). You should report major trends in analysis done in part (B). Furthermore, you are required to report trends in trend analysis conducted in part (C)
Step by Step Solution
There are 3 Steps involved in it

Get step-by-step solutions from verified subject matter experts