

Question: Cumulative Table chirka probability represent the shaded arca in the figure FIRST DIGIT OF SECOND DIGIT OF F -10 10013 -10 -17 -26 -24 HOOTS
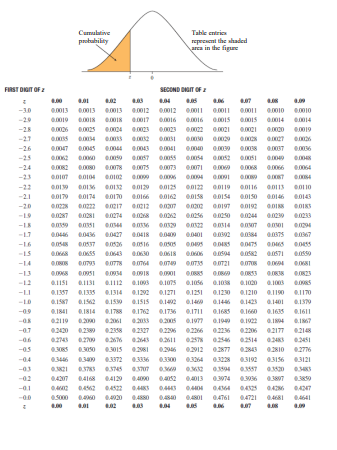
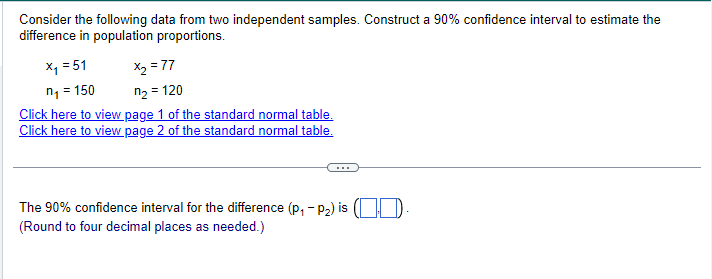
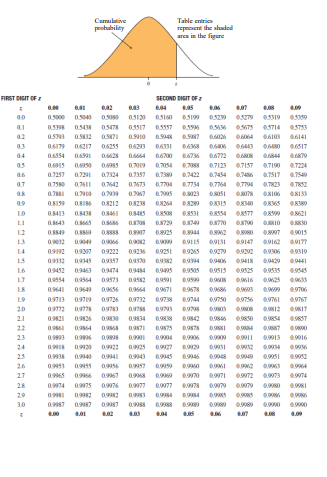
Cumulative Table chirka probability represent the shaded arca in the figure FIRST DIGIT OF SECOND DIGIT OF F -10 10013 -10 -17 -26 -24 HOOTS 001 19 -21 10170 40150 -70 00197 COLAY 10274 -IN -LT THE'S THIS -16 -14 COTTA -13 D.1075 -LI 0.13IA 0.127I 0.1210 0.1515 011401 CITII 621 19 6.19FF -0.T -03 1877 -04 -011 13974 -01Consider the following data from two independent samples. Construct a 90% confidence interval to estimate the difference in population proportions. X, = 51 X- =77 ng = 150 n2 = 120 Click here to view page 1 of the standard normal table. Click here to view page 2 of the standard normal table. The 90% confidence interval for the difference (p, - p2) is (Round to four decimal places as needed.)Table circa probability represent the shaded arca in the figure FIRST DIGIT OF SECOND DIGIT OF 04019 CENS TI 04 04554 0.7019 0.71:24 0.7IST 63157 03201 07157 107412 0.7517 0.7641 0.7573 0.7AH4 0.7734 0.77 04212 0.4214 05451 0.4-145 08554 LI 49013 09235 09345 0LA279 COLIN 16 03432 043453 09474 09454 049515 IT 0.4954 09564 09751 ALTET 21 23 24 23 27
Step by Step Solution
There are 3 Steps involved in it

Get step-by-step solutions from verified subject matter experts