

Cuppa Inc. operates a chain of doughnut shops. The company is considering two possible expansion plans...
Fantastic news! We've Found the answer you've been seeking!
Question:
Transcribed Image Text:
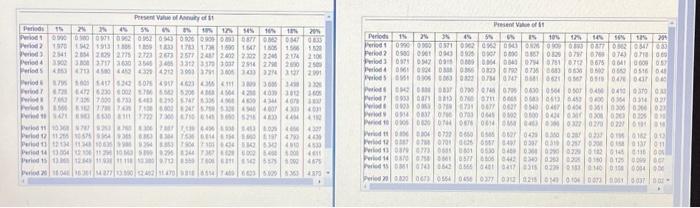
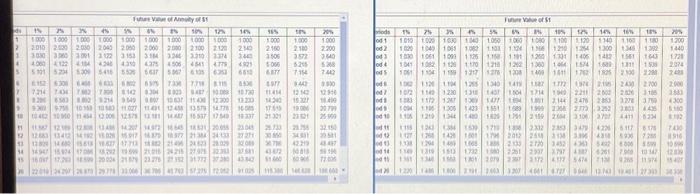
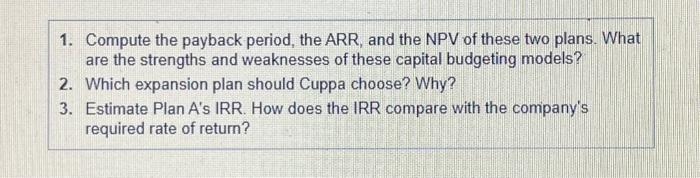
Cuppa Inc. operates a chain of doughnut shops. The company is considering two possible expansion plans Plan A would open eight smaller shops at a cost of $8,940,000 Expected annual net cash inflows are $1,750,000 with zero residual value at the end of ten years Under Plan B. Cuppa would open three larger shops at a cost of $8,840,000 This plan is expected to generate net cash inflows of $1,450,000 per year for ten years, the estimated life of the properties Estimated residual value is $975,000 Cuppa uses straight-line depreciation and requires an annual return of 8% (Click the icon to view the present value annuity factor table) (Click the icon to view the future value annuity factor table) Read the requirements (Click the icon to view the present value factor table) (Click the icon to view the future value factor table) Present Value of Annuity of $1 2% 2% 2 Periods Period 1 09900 071 0962 0962 0943 0906083 0877 M2 0047 Period 2 1970 1942 1913 1306 1809 133 173 1738 1.000 1647 1805 1506 Period 2541 2854 2829 2775 2723 2673 2577 248 2.402 2302 2246 2174 Period 43902 3800 3717 3630 3545 3405 3312 3370 3037 2914 2790 2000 2500 Period 5 43 4713 4500 442 4329 4212 3003 3791 3005 3433 324 32091 Periods 1795 5000 5417 5242 5075 4917 4623 436 4111 309 3005 348 3308 Period 7 7 472 6230 002 706 6542 5206 43 45044250 400 3012 140 Pero 72 730 7500 733 643 290 747 305 406 400 43M 400 Peles 150 12 778 74 7.40 6.602 247 5750 532 4940 4.007 4303 5% 0% " 10% 12% 54% 10% 18% 20% Periods 1% 2% 3% Period 1 Period 2 2106 Periods Periods 4AM 4001 4110 Period 11 1036787 23 6 306 7704406000 453 025 4 Period 14 13 0042106 11 29 10 M 5390 295 Period 15 126 1264 1138 11 18 230 9712 30 44 344 732 428 550 780631 542 Period 20 1604163614277 13.500 12402] 11.470] 18 [854] 746623 32 632 4910 4530 002 48000 411 5575 000 4475 5309 5363 4.370 Period 3 Period 4 Present Value of $1 5% 10% 15 10% 12% 14% 10% 12% 254 0.990 0000 0371 092 0962 043 026 0909 0.893 0.877 020847683 05000961 0943 0925 0907 0800 0857 0825 075 076 0743 0.718 069 0371 0342 0915 0809 0004 0040 0754 0761 0712 0675 0641 00009 057 0061 0924 038 0356 0823 790 0736 8683 6636 502 052 0516 048 551 0306 063 0822 074 0747 0481 0621 0567 0515 0476 0437 040 42 080 0837 0700 0746 0705 0430 0504 0507 0450 0410 0370 0 Period 7933 0475 813 0766 6711 00s osas 0413 0453 0400 6564 0314 0.27 Period 403 | 0053 0789 731 0477 0627 0540 0467 0404 0361 0306 0266 023 Pods 0914 0837 070 0703 0445 0500 05000424 036 0308 0263 0225 Period 10 005 0020 0744 0876 0614 M 4000322 0270 0227 0191 18 Period 11 06 0304 0722 0650 6585 0627 0429 030 0287 0337 0196 0182 013 Period 12 0387 078 0701 0426 6567 8497 0397 0319 0257 0208 0158 0137 011 Period 13 0379 0773 0601 601 6530 0409 0308 0290 0229 0182 0145 0118 00 Period 14 0870 0758 661 0577 6506 0442 0340 0263 0225 0380 0125 0009 Period 15 0361 0743 0642 0565 0401 0417 0315 0239 0183 0140 0108 0004 00 Period 200320 06730564 0456 0377 0312 0215 0149 0104 0073 0061 60370- Future Value of Annuity of $1 d 15 2% 3% 4% 1000 1000 1000 1000 1000 2010 2000 2030 2040 3030 3000 3001 3172 4060 4122 4104 4240 2050 3153 4350 15 25 10% 12% 1000 1.000 1,000 1.000 2000 2000 2100 2120 31M 324 3210 3374 14% 115 10% 7% 2 10% 1000 1000 1.000 1.000 1010 21340 2100 2.100 2.200 340 3506 3572 340 4375 4506 5101 52 5300 5416 4779 4921 6417 5067 6135 6353 6610 6066 525 6.877 7154 5368 1030 1040 1050 1049 1065 1.062 1.10 1000 1061 1000 1125 1041 1082 1120 1170 1218 1262 1000 7442 od 5 1104 6152 630 7214 7AM M 730142 6375 73 73W 0304 500 4977 3442 11454 12 143 214 3549 920 9755 10:35 104 1090 11 454 180 12 006 13637 11400 1200 11.027 11401 12:45 13579 14.77 12875| 12181 16 13230 14.340 12916 15327 1409 1605 17515 30799 16 557 17543 18337 21301 23121 1 12 57 129 1280 12AM 12883 13412 14192 102 42073432 16645 1821 2005 15917 14 375 377 2134 34133 121289 14.00 5613 627 773 2 246 24823 2029 34 34947 15 904 170M 1,282 999 2016 24215 27975 323 371 1607 17.23 1500 2000 21879 23 276 27382 31772 373804332 15 22010422687 2977330063706 4763 525 202 1025 4342 $1400 23045 27271 2733 21.758 32.150 1217 1276 1308 1002 1120 1104 1205 1340 1475 10/2 1140 1230 13 1407 1004 1367 100 sant 1894 1306 1423 1219 1344 1480 1243 Future Value of $1 16 12% 14% 16% 18% 1080 100 1106 1340 1160 1180 1200 1254 1300 1340 1392 1440 1200 1301 1406 140 1561 1643 1728 1574 1.689 1400 1411 1702 1825 2100 1387 1m 1970 21 2430 1714 1040 2211 2602 226 22M 24 1538 2074 2.700 2000 3105 2883 1851 1829 300 34831 201 20 7 42299 125 1428 1801 17 13081294 1065 1 2332 283 3479 423 2012 2618 3138 336 43 2133 2720 3452 363 2144 2476 283 327 37 238 277 3252 2003 4436 5100 1791 219 20 3106 3707 4411 6117 4300 8102 7430 916 6000 1732 1303 2937 3797 438 6261 3172 177 5474 71 1230 1.800 3200 461 4727 54 120 230 1. Compute the payback period, the ARR, and the NPV of these two plans. What are the strengths and weaknesses of these capital budgeting models? 2. Which expansion plan should Cuppa choose? Why? 3. Estimate Plan A's IRR. How does the IRR compare with the company's required rate of return? Cuppa Inc. operates a chain of doughnut shops. The company is considering two possible expansion plans Plan A would open eight smaller shops at a cost of $8,940,000 Expected annual net cash inflows are $1,750,000 with zero residual value at the end of ten years Under Plan B. Cuppa would open three larger shops at a cost of $8,840,000 This plan is expected to generate net cash inflows of $1,450,000 per year for ten years, the estimated life of the properties Estimated residual value is $975,000 Cuppa uses straight-line depreciation and requires an annual return of 8% (Click the icon to view the present value annuity factor table) (Click the icon to view the future value annuity factor table) Read the requirements (Click the icon to view the present value factor table) (Click the icon to view the future value factor table) Present Value of Annuity of $1 2% 2% 2 Periods Period 1 09900 071 0962 0962 0943 0906083 0877 M2 0047 Period 2 1970 1942 1913 1306 1809 133 173 1738 1.000 1647 1805 1506 Period 2541 2854 2829 2775 2723 2673 2577 248 2.402 2302 2246 2174 Period 43902 3800 3717 3630 3545 3405 3312 3370 3037 2914 2790 2000 2500 Period 5 43 4713 4500 442 4329 4212 3003 3791 3005 3433 324 32091 Periods 1795 5000 5417 5242 5075 4917 4623 436 4111 309 3005 348 3308 Period 7 7 472 6230 002 706 6542 5206 43 45044250 400 3012 140 Pero 72 730 7500 733 643 290 747 305 406 400 43M 400 Peles 150 12 778 74 7.40 6.602 247 5750 532 4940 4.007 4303 5% 0% " 10% 12% 54% 10% 18% 20% Periods 1% 2% 3% Period 1 Period 2 2106 Periods Periods 4AM 4001 4110 Period 11 1036787 23 6 306 7704406000 453 025 4 Period 14 13 0042106 11 29 10 M 5390 295 Period 15 126 1264 1138 11 18 230 9712 30 44 344 732 428 550 780631 542 Period 20 1604163614277 13.500 12402] 11.470] 18 [854] 746623 32 632 4910 4530 002 48000 411 5575 000 4475 5309 5363 4.370 Period 3 Period 4 Present Value of $1 5% 10% 15 10% 12% 14% 10% 12% 254 0.990 0000 0371 092 0962 043 026 0909 0.893 0.877 020847683 05000961 0943 0925 0907 0800 0857 0825 075 076 0743 0.718 069 0371 0342 0915 0809 0004 0040 0754 0761 0712 0675 0641 00009 057 0061 0924 038 0356 0823 790 0736 8683 6636 502 052 0516 048 551 0306 063 0822 074 0747 0481 0621 0567 0515 0476 0437 040 42 080 0837 0700 0746 0705 0430 0504 0507 0450 0410 0370 0 Period 7933 0475 813 0766 6711 00s osas 0413 0453 0400 6564 0314 0.27 Period 403 | 0053 0789 731 0477 0627 0540 0467 0404 0361 0306 0266 023 Pods 0914 0837 070 0703 0445 0500 05000424 036 0308 0263 0225 Period 10 005 0020 0744 0876 0614 M 4000322 0270 0227 0191 18 Period 11 06 0304 0722 0650 6585 0627 0429 030 0287 0337 0196 0182 013 Period 12 0387 078 0701 0426 6567 8497 0397 0319 0257 0208 0158 0137 011 Period 13 0379 0773 0601 601 6530 0409 0308 0290 0229 0182 0145 0118 00 Period 14 0870 0758 661 0577 6506 0442 0340 0263 0225 0380 0125 0009 Period 15 0361 0743 0642 0565 0401 0417 0315 0239 0183 0140 0108 0004 00 Period 200320 06730564 0456 0377 0312 0215 0149 0104 0073 0061 60370- Future Value of Annuity of $1 d 15 2% 3% 4% 1000 1000 1000 1000 1000 2010 2000 2030 2040 3030 3000 3001 3172 4060 4122 4104 4240 2050 3153 4350 15 25 10% 12% 1000 1.000 1,000 1.000 2000 2000 2100 2120 31M 324 3210 3374 14% 115 10% 7% 2 10% 1000 1000 1.000 1.000 1010 21340 2100 2.100 2.200 340 3506 3572 340 4375 4506 5101 52 5300 5416 4779 4921 6417 5067 6135 6353 6610 6066 525 6.877 7154 5368 1030 1040 1050 1049 1065 1.062 1.10 1000 1061 1000 1125 1041 1082 1120 1170 1218 1262 1000 7442 od 5 1104 6152 630 7214 7AM M 730142 6375 73 73W 0304 500 4977 3442 11454 12 143 214 3549 920 9755 10:35 104 1090 11 454 180 12 006 13637 11400 1200 11.027 11401 12:45 13579 14.77 12875| 12181 16 13230 14.340 12916 15327 1409 1605 17515 30799 16 557 17543 18337 21301 23121 1 12 57 129 1280 12AM 12883 13412 14192 102 42073432 16645 1821 2005 15917 14 375 377 2134 34133 121289 14.00 5613 627 773 2 246 24823 2029 34 34947 15 904 170M 1,282 999 2016 24215 27975 323 371 1607 17.23 1500 2000 21879 23 276 27382 31772 373804332 15 22010422687 2977330063706 4763 525 202 1025 4342 $1400 23045 27271 2733 21.758 32.150 1217 1276 1308 1002 1120 1104 1205 1340 1475 10/2 1140 1230 13 1407 1004 1367 100 sant 1894 1306 1423 1219 1344 1480 1243 Future Value of $1 16 12% 14% 16% 18% 1080 100 1106 1340 1160 1180 1200 1254 1300 1340 1392 1440 1200 1301 1406 140 1561 1643 1728 1574 1.689 1400 1411 1702 1825 2100 1387 1m 1970 21 2430 1714 1040 2211 2602 226 22M 24 1538 2074 2.700 2000 3105 2883 1851 1829 300 34831 201 20 7 42299 125 1428 1801 17 13081294 1065 1 2332 283 3479 423 2012 2618 3138 336 43 2133 2720 3452 363 2144 2476 283 327 37 238 277 3252 2003 4436 5100 1791 219 20 3106 3707 4411 6117 4300 8102 7430 916 6000 1732 1303 2937 3797 438 6261 3172 177 5474 71 1230 1.800 3200 461 4727 54 120 230 1. Compute the payback period, the ARR, and the NPV of these two plans. What are the strengths and weaknesses of these capital budgeting models? 2. Which expansion plan should Cuppa choose? Why? 3. Estimate Plan A's IRR. How does the IRR compare with the company's required rate of return?
Expert Answer:

Related Book For 
Posted Date:
Students also viewed these finance questions
-
Discuss the implications of the following statement: It is interesting to note that poultry is Indias most efficient converter of low fibre food stuff (which is unfit for human consumption) into...
-
the IP address are for illustrative purposes only. Use your own IP addressing scheme (You may use classful and classless IP addresses as per your preference). Note that students need to attach the...
-
Solve the preceding problem if the element is steel (E = 200 GPA, v = 0.30) with dimensions a = 300 mm, b = 150 mm, and c = 150 mm and the stresses are (x = - 60 MPa, (y = - 40 MPa, and (z = - 40 MPa?
-
An air ambulance is travelling from Barrie to Toronto. Toronto is located 90 km [S5degreesE] of Barrie. If the wind is blowing from the south with a velocity of 35k/h, and the planes air speed is...
-
Literacy Rate Figure 2.39 gives a boxplot showing the literacy rate of the countries of the world. Figure 2.39 Literacy rate for countries of the world (a) Describe the shape of the distribution. (b)...
-
The stockholders equity accounts of Joey Corporation on January 1, 2012, were as follows. Preferred Stock (10%, $100 par, noncumulative, 5,000 shares authorized).. $ 300,000 Common Stock ($5 stated...
-
what extent does cultural context shape the sources and manifestations of inspiration across diverse societies and historical epochs ?
-
Iron Bowl At an AuburnAlabama game, 80 percent of attendees wore Alabama gear and 20 percent wore Auburn gear. During the game, one of the attendees apparently robbed a beer stand outside the...
-
There are three types of money: commodity money, commodity-backed money, and fiat money. Which type of money is used in each of the following situations? a. Bottles of rum were used to pay for goods...
-
The Congressional Research Service estimates that at least $45 million of counterfeit U.S. $100 notes produced by the North Korean government are in circulation. a. Why do U.S. taxpayers lose because...
-
The government of Eastlandia uses measures of monetary aggregates similar to those used by the United States, and the central bank of Eastlandia imposes a required reserve ratio of 10%. Given the...
-
Although the U.S. Federal Reserve doesnt use changes in reserve requirements to manage the money supply, the central bank of Albernia does. The commercial banks of Albernia have $100 million in...
-
Unlike households, governments are often able to sustain large debts. For example, in 2016, the U.S. governments total debt reached $19.5 trillion, approximately equal to 106.1% of GDP. At the time,...
-
Suppose that the market for cashmere sweaters is a competitive market. The following graph shoes the daily dost curves of a firm operating in this market For each price in the following table,...
-
Identify Thank You mission, strategy and core competencies. Identify strategy changes that have taken place at Thank You since its founding in 2008. Your answer must in text references and must be...
-
The Sun contains what percentage of the solar systems mass? (a) about 35% (b) 85% (c) the percentage varies over time (d) over 99%
-
Each second, the burning Suns mass (a) increases. (b) remains unchanged. (c) decreases.
-
The nebular theory is based on the observation that the solar system (a) follows patterns indicating that it formed progressively from physical processes. (b) has a structure much like an atom. (c)...

Study smarter with the SolutionInn App