

Question: CURRENT 1MA RTD Reference Temperature (C) Error (%) Measured Voltage (mv) Calculated Resistance (92) Standard Resistancefrom specifications (22) Deviation (22) 23. 25 30 35 40
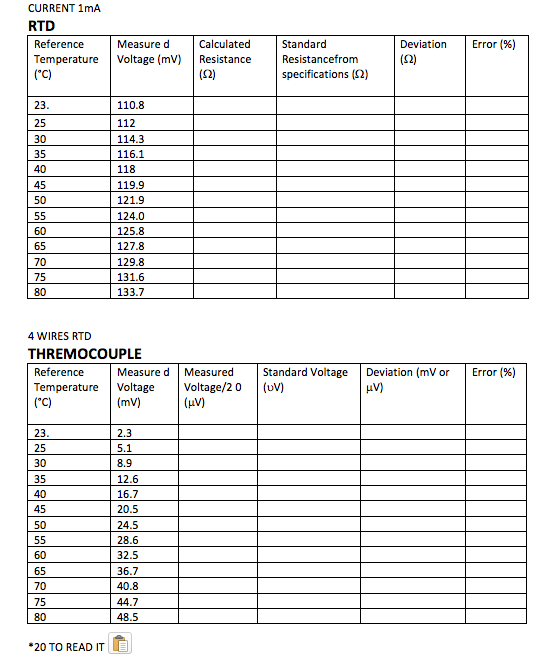
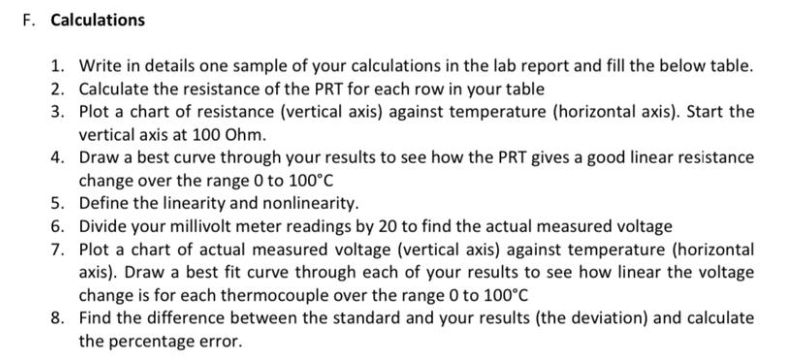
CURRENT 1MA RTD Reference Temperature (C) Error (%) Measured Voltage (mv) Calculated Resistance (92) Standard Resistancefrom specifications (22) Deviation (22) 23. 25 30 35 40 45 50 55 60 65 70 75 80 110.8 112 114.3 116.1 118 119.9 121.9 124.0 125.8 127.8 129.8 131.6 133.7 4 WIRES RTD THREMOCOUPLE Reference Measured Temperature Voltage (C) (mv) Error (%) Measured Voltage/20 (LV) Standard Voltage (UV) Deviation (mV or uV) 23. 25 30 35 40 45 50 55 60 65 70 75 80 2.3 5.1 8.9 12.6 16.7 20.5 24.5 28.6 32.5 36.7 40.8 44.7 48.5 *20 TO READ IT F. Calculations 1. Write in details one sample of your calculations in the lab report and fill the below table. 2. Calculate the resistance of the PRT for each row in your table 3. Plot a chart of resistance (vertical axis) against temperature (horizontal axis). Start the vertical axis at 100 Ohm. 4. Draw a best curve through your results to see how the PRT gives a good linear resistance change over the range 0 to 100C 5. Define the linearity and nonlinearity. 6. Divide your millivolt meter readings by 20 to find the actual measured voltage 7. Plot a chart of actual measured voltage (vertical axis) against temperature (horizontal axis). Draw a best fit curve through each of your results to see how linear the voltage change is for each thermocouple over the range 0 to 100C 8. Find the difference between the standard and your results (the deviation) and calculate the percentage error
Step by Step Solution
There are 3 Steps involved in it

Get step-by-step solutions from verified subject matter experts