

Question: Current Attempt in Progress Senator ages The following dotplot shows the distribution of ages of the 100 members of the United States Senate as of
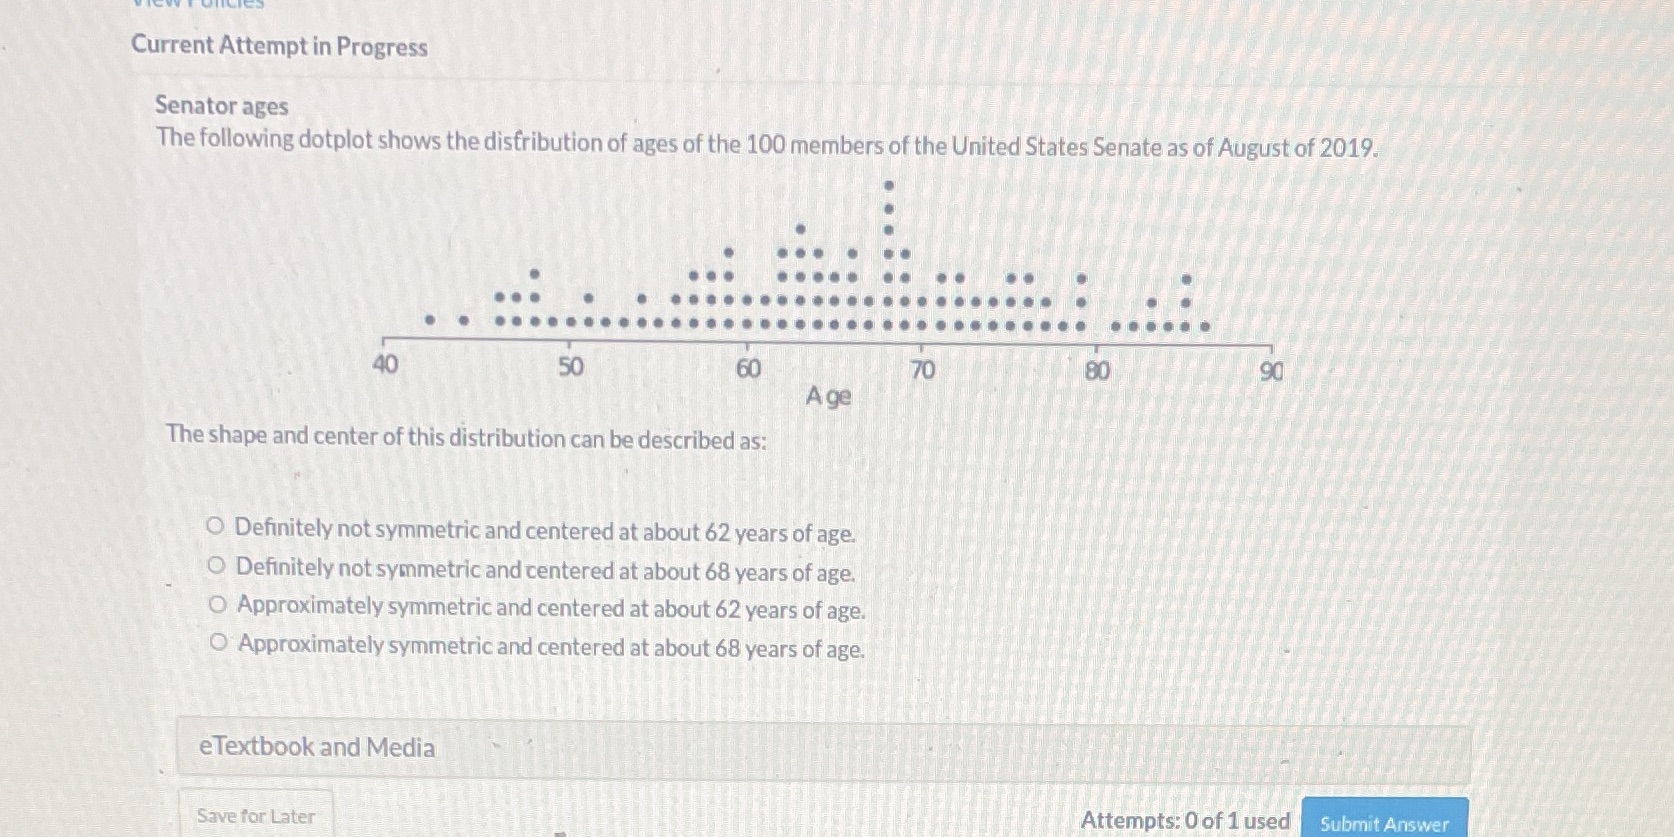
Current Attempt in Progress Senator ages The following dotplot shows the distribution of ages of the 100 members of the United States Senate as of August of 2019. 40 50 60 70 80 90 A ge The shape and center of this distribution can be described as: O Definitely not symmetric and centered at about 62 years of age. O Definitely not symmetric and centered at about 68 years of age. O Approximately symmetric and centered at about 62 years of age. O Approximately symmetric and centered at about 68 years of age. eTextbook and Media Save for Later Attempts: 0 of 1 used Submit
Step by Step Solution
There are 3 Steps involved in it
1 Expert Approved Answer
Step: 1 Unlock

Question Has Been Solved by an Expert!
Get step-by-step solutions from verified subject matter experts
Step: 2 Unlock
Step: 3 Unlock