

Question: Current event assignment for the final week. A. Using current data for AAPL stock draw a chart as shown for call option maturing in about
Current event assignment for the final week. A. Using current data for AAPL stock draw a chart as shown for call option maturing in about six months.
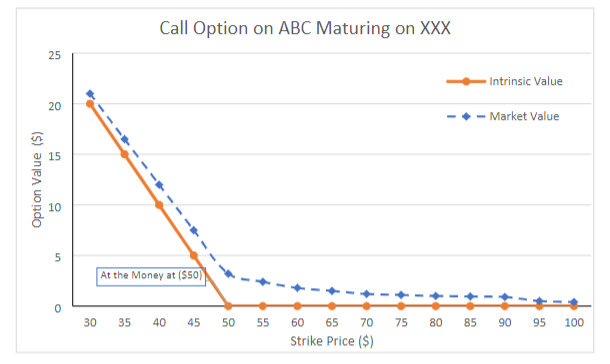 Requirements for the chart: X- axis is solid black color line Y-axis is also a solid black color line The blue line is smoothed, dashed, and thinner The blue markers are of different type than the orange one Choose both the mini and max value for the x-axis and the y-axis such that it fits value properly Have a data label to Identify at-the-money point Chart title should be self-explanatory, be of proper size and be located properly The legend should be explanatory and be located properly to maximize use of chart area Both the axes should be labeled properly. They should include the unit of measurement. Should have horizontal grid lines at appropriate points. No vertical gridlines. Do not use more than 15 Data points for each series.
Note that intrinsic value is the maximum of zero or (current stock price - strike price).
B. Do the same exercise based on current put option prices. (Note the formula for intrinsic value will change for put options).
There are two main objectives for this exercise. 1) Understand option pricing better; 2) Improve charting skills in Excel.
Call Option on ABC Maturing on XXX
Step by Step Solution
There are 3 Steps involved in it

Get step-by-step solutions from verified subject matter experts