

Question: Use Excel charts to visualize the solution for the Sklenka Skis example that we discussed in Chapter 13 and in this chapter. Use the Solver
Use Excel charts to visualize the solution for the Sklenka Skis example that we discussed in Chapter 13 and in this chapter. Use the Solver Answer Report (Figure 13.5) and the Sensitivity Report (Figure 15.3). Use the Sklenka Skis Excel file to generate these reports and facilitate your analysis.
Data from Figure 15.3
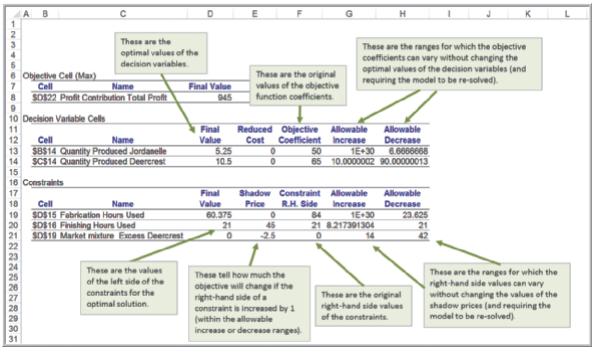
A B 10 Decision Variable Cells 11 12 17 18 2858885 These are the optimal values of the decision variables Objective Cell (Max) Cell Name $0$22 Profit Contribution Total Profit Cell Name 13 $B$14 Quantity Produced Jordanelle 14 SC$14 Quantity Produced Deercrest 15 16 Constraints Cell Name 19 SD$15 Fabrication Hours Used 20 $D$16 Finishing Hours Used 21 SOS19 Market mixture Excess Deercrest These are the values of the left side of the constraints for the optimal solution. Final Value 945 Final Value 5.25 10.5 Final Value 60.375 21 0 These are the original values of the objective function coefficients Reduced Objective Allowable Cost Coefficient increase 0 0 Shadow Constraint Price R.H. Side 0 45 25 50 65 These tell how much the objective will change if the right-hand side of a constraint is increased by 1 (within the allowable increase or decrease ranges) These are the ranges for which the objective coefficients can vary without changing the optimal values of the decision variables (and requiring the model to be re-solved). Allowable Decrease 6.6666668 1E+30 10.0000002 90.00000013 Allowable Increase 1E+30 84 21 8.217391304 D 14 Allowable Decrease 23.625 21 42 These are the original right-hand side values of the constraints These are the ranges for which the right-hand side values can vary without changing the values of the shadow prices (and requiring the model to be re-solved)
Step by Step Solution
3.43 Rating (159 Votes )
There are 3 Steps involved in it
Sklenka Skis Data Product Department Jordanelle Deercrest Limitatio... View full answer

Get step-by-step solutions from verified subject matter experts