

Question: Current & Quick Ratio FIXED ASSET TURNOVER AND TOTAL ASSET TURNOVER NET PROFIT MARGIN RETURN ON ASSET RETURN ON EQUITY DEBT RATIO EQUITY RATIO BELOW
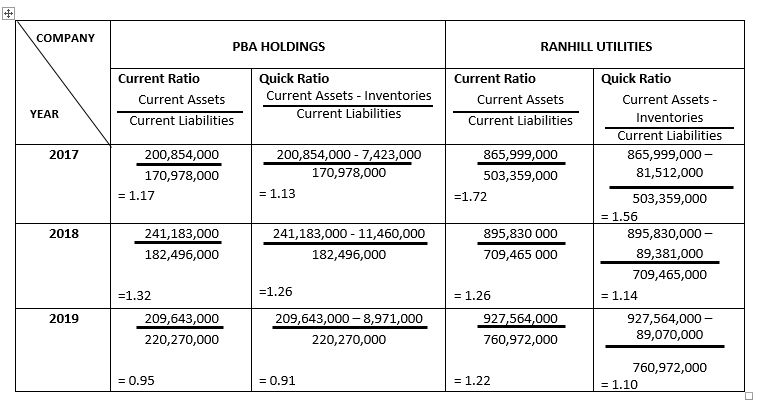
Current & Quick Ratio
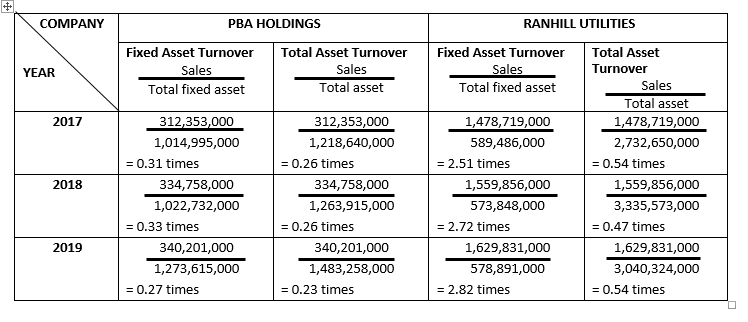
FIXED ASSET TURNOVER AND TOTAL ASSET TURNOVER
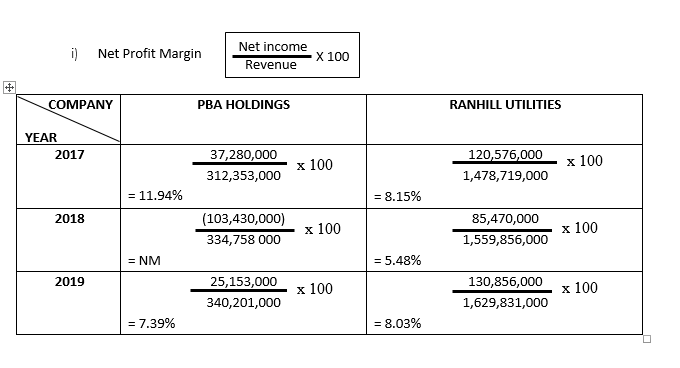
NET PROFIT MARGIN
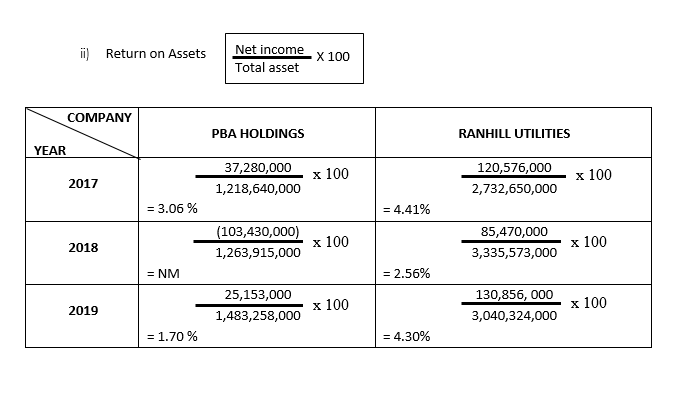
RETURN ON ASSET
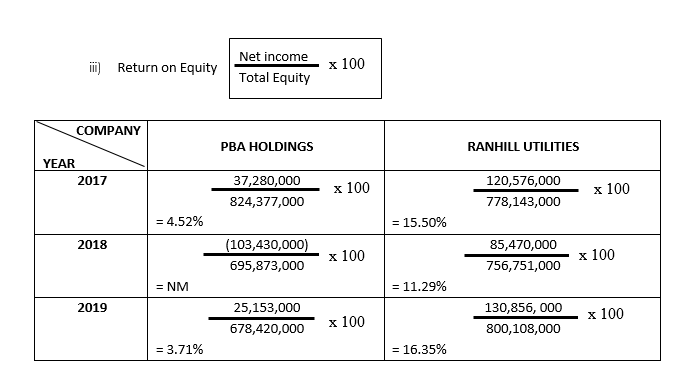
RETURN ON EQUITY
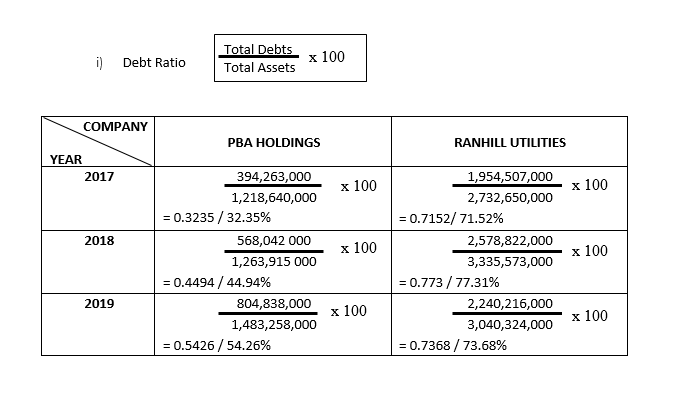
DEBT RATIO
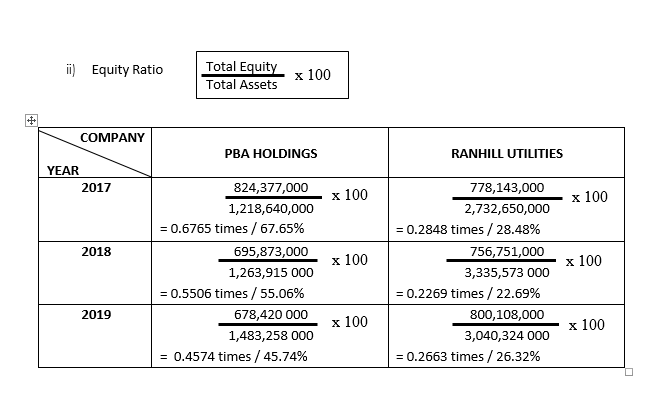
EQUITY RATIO
BELOW ARE THE SAMPLE CHART:
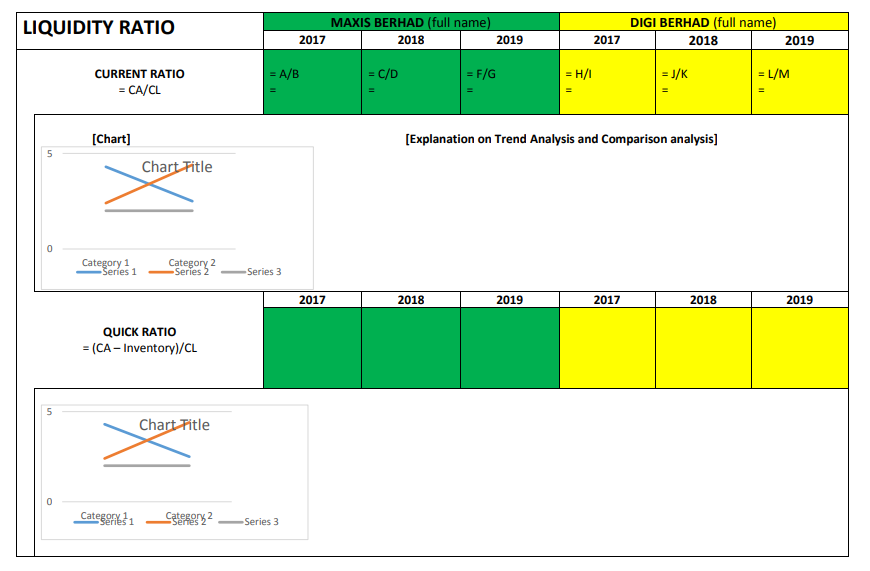
- Compare & analyze the financial ratios between two companies and provide explanation based on both Trend Analysis and Comparison Analysis
a.) Use a horizontal (landscape) box format in Microsoft Word.
- Show all formula and calculations for the all financial ratios in each year.
- Show the graph of the trend of EACH RATIO. (SAMPLE GRAPH AS PROVIDED)
- Write your analysis based on
- Trend Analysis [year by year performance for each company]; and
- Comparison Analysis [ year by year performance between the two companies).
Note: Must use adverbs or adjectives in your description analysis. Examples:
- The current ratio for 2019 is slightly lower than that of 2018 because
- In 2019, the current ratio for Maxis is significantly higher than
COMPANY PBA HOLDINGS RANHILL UTILITIES Current Ratio Current Assets Current Liabilities Quick Ratio Current Assets - Inventories Current Liabilities Current Ratio Current Assets Current Liabilities YEAR 2017 200,854,000 170,978,000 = 1.17 200,854,000 - 7,423,000 170,978,000 = 1.13 865,999,000 503,359,000 = 1.72 Quick Ratio Current Assets Inventories Current Liabilities 865,999,000 - 81,512,000 503,359,000 = 1.56 895,830,000 - 89,381,000 709,465,000 = 1.14 2018 241,183,000 182,496,000 241,183,000 - 11,460,000 182,496,000 895,830 000 709,465 000 =1.32 =1.26 2019 209,643,000 220,270,000 209,643,000 -8,971,000 220,270,000 = 1.26 927,564,000 760,972,000 927,564,000 - 89,070,000 = 0.95 = 0.91 = 1.22 760,972,000 = 1.10 COMPANY PBA HOLDINGS RANHILL UTILITIES YEAR Fixed Asset Turnover Sales Total fixed asset Total Asset Turnover Sales Total asset Fixed Asset Turnover Sales Total fixed asset 2017 312,353,000 1,014,995,000 = 0.31 times 334,758,000 1,022,732,000 = 0.33 times 340,201,000 1,273,615,000 = 0.27 times 2018 312,353,000 1,218,640,000 = 0.26 times 334,758,000 1,263,915,000 = 0.26 times 340,201,000 1,483,258,000 = 0.23 times Total Asset Turnover Sales Total asset 1,478,719,000 2,732,650,000 = 0.54 times 1,559,856,000 3,335,573,000 = 0.47 times 1,629,831,000 3,040,324,000 = 0.54 times 1,478,719,000 589,486,000 = 2.51 times 1,559,856,000 573,848,000 = 2.72 times 1,629,831,000 578,891,000 = 2.82 times 2019 i) Net Profit Margin Net income X 100 Revenue # COMPANY PBA HOLDINGS RANHILL UTILITIES YEAR 2017 37,280,000 312,353,000 x 100 120,576,000 1,478,719,000 x 100 = 11.94% = 8.15% 2018 (103,430,000) 334,758 000 x 100 85,470,000 1,559,856,000 x 100 = NM = 5.48% 2019 25,153,000 340,201,000 x 100 130,856,000 1,629,831,000 x 100 = 7.39% = 8.03% ii) Return on Assets Net income Total asset X 100 COMPANY PBA HOLDINGS RANHILL UTILITIES YEAR 37,280,000 1,218,640,000 x 100 2017 120,576,000 2,732,650,000 x 100 = 3.06% = 4.41% 2018 (103,430,000) 1,263,915,000 x 100 85,470,000 3,335,573,000 x 100 = NM = 2.56% 2019 25,153,000 1,483,258,000 x 100 130,856, 000 3,040,324,000 x 100 = 1.70 % = 4.30% c) Return on Equity Net income Total Equity x 100 COMPANY PBA HOLDINGS RANHILL UTILITIES YEAR 2017 37,280,000 824,377,000 x 100 120,576,000 778,143,000 x 100 = 4.52% = 15.50% 2018 (103,430,000) 695,873,000 x 100 85,470,000 756,751,000 x 100 = NM = 11.29% 2019 25,153,000 678,420,000 130,856, 000 800,108,000 x 100 x 100 = 3.71% = 16.35% i) Debt Ratio Total Debts Total Assets x 100 COMPANY PBA HOLDINGS RANHILL UTILITIES YEAR 2017 x 100 x 100 2018 x 100 x 100 394,263,000 1,218,640,000 = 0.3235 / 32.35% 568,042 000 1,263,915 000 = 0.4494 / 44.94% 804,838,000 1,483,258,000 = 0.5426 / 54.26% 1,954,507,000 2,732,650,000 = 0.7152/ 71.52% 2,578,822,000 3,335,573,000 = 0.773 / 77.31% 2,240,216,000 3,040,324,000 = 0.7368 / 73.68% 2019 x 100 x 100 ii) Equity Ratio Total Equity Total Assets x 100 + COMPANY PBA HOLDINGS RANHILL UTILITIES YEAR 2017 x 100 x 100 2018 x 100 x 100 824,377,000 1,218,640,000 = 0.6765 times / 67.65% 695,873,000 1,263,915 000 = 0.5506 times / 55.06% 678,420 000 1,483,258 000 = 0.4574 times / 45.74% 778,143,000 2,732,650,000 = 0.2848 times / 28.48% 756,751,000 3,335,573 000 = 0.2269 times / 22.69% 800,108,000 3,040,324 000 = 0.2663 times / 26.32% 2019 x 100 x 100 LIQUIDITY RATIO MAXIS BERHAD (full name) 2017 2018 2019 DIGI BERHAD (full name) 2018 2019 2017 = A/B = C/D = F/G = H/1 = J/K = L/M CURRENT RATIO = CA/CL [Chart] [Explanation on Trend Analysis and Comparison analysis] 5 Chart Fitle 0 Category 1 Series 1 Category 2 Series 2 Series 3 2017 2018 2019 2017 2018 2019 QUICK RATIO = (CA - Inventory)/CL 5 Chart Fitle 0 Categorie 31 2 -Series 2 Series 3 COMPANY PBA HOLDINGS RANHILL UTILITIES Current Ratio Current Assets Current Liabilities Quick Ratio Current Assets - Inventories Current Liabilities Current Ratio Current Assets Current Liabilities YEAR 2017 200,854,000 170,978,000 = 1.17 200,854,000 - 7,423,000 170,978,000 = 1.13 865,999,000 503,359,000 = 1.72 Quick Ratio Current Assets Inventories Current Liabilities 865,999,000 - 81,512,000 503,359,000 = 1.56 895,830,000 - 89,381,000 709,465,000 = 1.14 2018 241,183,000 182,496,000 241,183,000 - 11,460,000 182,496,000 895,830 000 709,465 000 =1.32 =1.26 2019 209,643,000 220,270,000 209,643,000 -8,971,000 220,270,000 = 1.26 927,564,000 760,972,000 927,564,000 - 89,070,000 = 0.95 = 0.91 = 1.22 760,972,000 = 1.10 COMPANY PBA HOLDINGS RANHILL UTILITIES YEAR Fixed Asset Turnover Sales Total fixed asset Total Asset Turnover Sales Total asset Fixed Asset Turnover Sales Total fixed asset 2017 312,353,000 1,014,995,000 = 0.31 times 334,758,000 1,022,732,000 = 0.33 times 340,201,000 1,273,615,000 = 0.27 times 2018 312,353,000 1,218,640,000 = 0.26 times 334,758,000 1,263,915,000 = 0.26 times 340,201,000 1,483,258,000 = 0.23 times Total Asset Turnover Sales Total asset 1,478,719,000 2,732,650,000 = 0.54 times 1,559,856,000 3,335,573,000 = 0.47 times 1,629,831,000 3,040,324,000 = 0.54 times 1,478,719,000 589,486,000 = 2.51 times 1,559,856,000 573,848,000 = 2.72 times 1,629,831,000 578,891,000 = 2.82 times 2019 i) Net Profit Margin Net income X 100 Revenue # COMPANY PBA HOLDINGS RANHILL UTILITIES YEAR 2017 37,280,000 312,353,000 x 100 120,576,000 1,478,719,000 x 100 = 11.94% = 8.15% 2018 (103,430,000) 334,758 000 x 100 85,470,000 1,559,856,000 x 100 = NM = 5.48% 2019 25,153,000 340,201,000 x 100 130,856,000 1,629,831,000 x 100 = 7.39% = 8.03% ii) Return on Assets Net income Total asset X 100 COMPANY PBA HOLDINGS RANHILL UTILITIES YEAR 37,280,000 1,218,640,000 x 100 2017 120,576,000 2,732,650,000 x 100 = 3.06% = 4.41% 2018 (103,430,000) 1,263,915,000 x 100 85,470,000 3,335,573,000 x 100 = NM = 2.56% 2019 25,153,000 1,483,258,000 x 100 130,856, 000 3,040,324,000 x 100 = 1.70 % = 4.30% c) Return on Equity Net income Total Equity x 100 COMPANY PBA HOLDINGS RANHILL UTILITIES YEAR 2017 37,280,000 824,377,000 x 100 120,576,000 778,143,000 x 100 = 4.52% = 15.50% 2018 (103,430,000) 695,873,000 x 100 85,470,000 756,751,000 x 100 = NM = 11.29% 2019 25,153,000 678,420,000 130,856, 000 800,108,000 x 100 x 100 = 3.71% = 16.35% i) Debt Ratio Total Debts Total Assets x 100 COMPANY PBA HOLDINGS RANHILL UTILITIES YEAR 2017 x 100 x 100 2018 x 100 x 100 394,263,000 1,218,640,000 = 0.3235 / 32.35% 568,042 000 1,263,915 000 = 0.4494 / 44.94% 804,838,000 1,483,258,000 = 0.5426 / 54.26% 1,954,507,000 2,732,650,000 = 0.7152/ 71.52% 2,578,822,000 3,335,573,000 = 0.773 / 77.31% 2,240,216,000 3,040,324,000 = 0.7368 / 73.68% 2019 x 100 x 100 ii) Equity Ratio Total Equity Total Assets x 100 + COMPANY PBA HOLDINGS RANHILL UTILITIES YEAR 2017 x 100 x 100 2018 x 100 x 100 824,377,000 1,218,640,000 = 0.6765 times / 67.65% 695,873,000 1,263,915 000 = 0.5506 times / 55.06% 678,420 000 1,483,258 000 = 0.4574 times / 45.74% 778,143,000 2,732,650,000 = 0.2848 times / 28.48% 756,751,000 3,335,573 000 = 0.2269 times / 22.69% 800,108,000 3,040,324 000 = 0.2663 times / 26.32% 2019 x 100 x 100 LIQUIDITY RATIO MAXIS BERHAD (full name) 2017 2018 2019 DIGI BERHAD (full name) 2018 2019 2017 = A/B = C/D = F/G = H/1 = J/K = L/M CURRENT RATIO = CA/CL [Chart] [Explanation on Trend Analysis and Comparison analysis] 5 Chart Fitle 0 Category 1 Series 1 Category 2 Series 2 Series 3 2017 2018 2019 2017 2018 2019 QUICK RATIO = (CA - Inventory)/CL 5 Chart Fitle 0 Categorie 31 2 -Series 2 Series 3
Step by Step Solution
There are 3 Steps involved in it

Get step-by-step solutions from verified subject matter experts