

Question: Current Ratio Average Collection Period (ACP) Inventory Turnover 4. Total Asset Turnover 5. Debt to Equity ratio 6. Times Interest Earned (TIE) 7. Return on
-
Current Ratio
-
Average Collection Period (ACP)
-
Inventory Turnover
4. Total Asset Turnover
5. Debt to Equity ratio
6. Times Interest Earned (TIE)
7. Return on Equity (ROE)
8. Price Earnings Ratio (P/E)
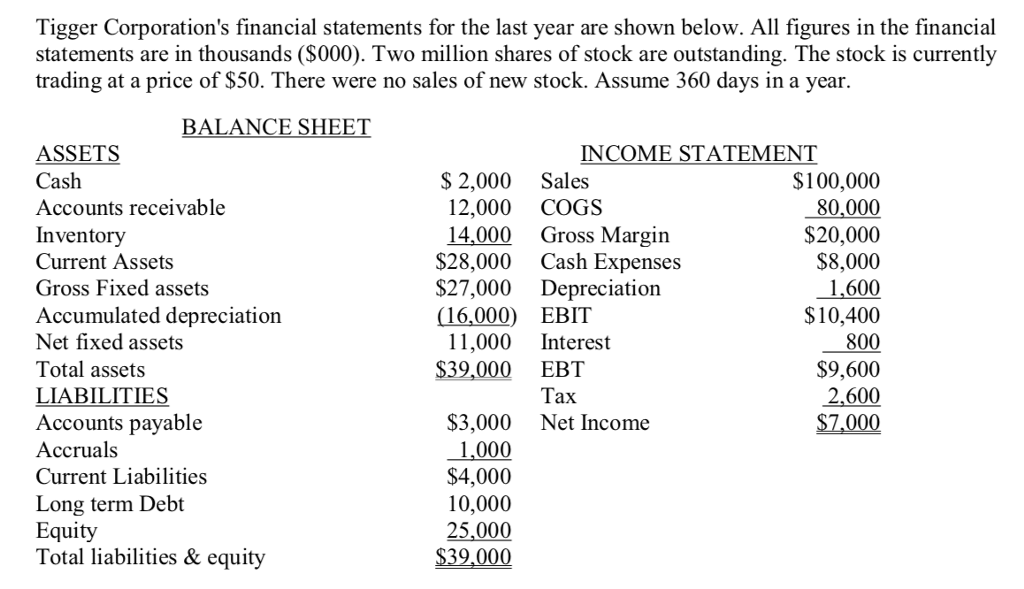
Tigger Corporation's financial statements for the last year are shown below. All figures in the financial statements are in thousands (S000). Two million shares of stock are outstanding. The stock is currently trading at a price of S50. There were no sales of new stock. Assume 360 days in a year. BALANCE SHEET ASSETS Cash Accounts receivable Inventory Current Assets Gross Fixed assets Accumulated depreciation Net fixed assets Total assets LIABILITIES Accounts payable Accruals Current Liabilities Long term Debt Equity Total liabilities & equity INCOME STATEMENT S 2,000Sales 12,000 COGS 14,000 Gross Margin S100,000 80,000 $20,000 $8,000 1.600 $10,400 800 $9,600 2,600 $7,000 S28,000 Cash Expenses $27,000 Depreciation 16,000) EBIT 11,000 Interest $39,000 EBT Tax S3,000 Net Income 1,000 $4,000 10,000 25,000 $39,000
Step by Step Solution
There are 3 Steps involved in it

Get step-by-step solutions from verified subject matter experts