

Question: Current ratio Quick ratio Inventory turnover Total asset turnover Return on sales Return on assets. Return on equity Total debt to assets Current ratio
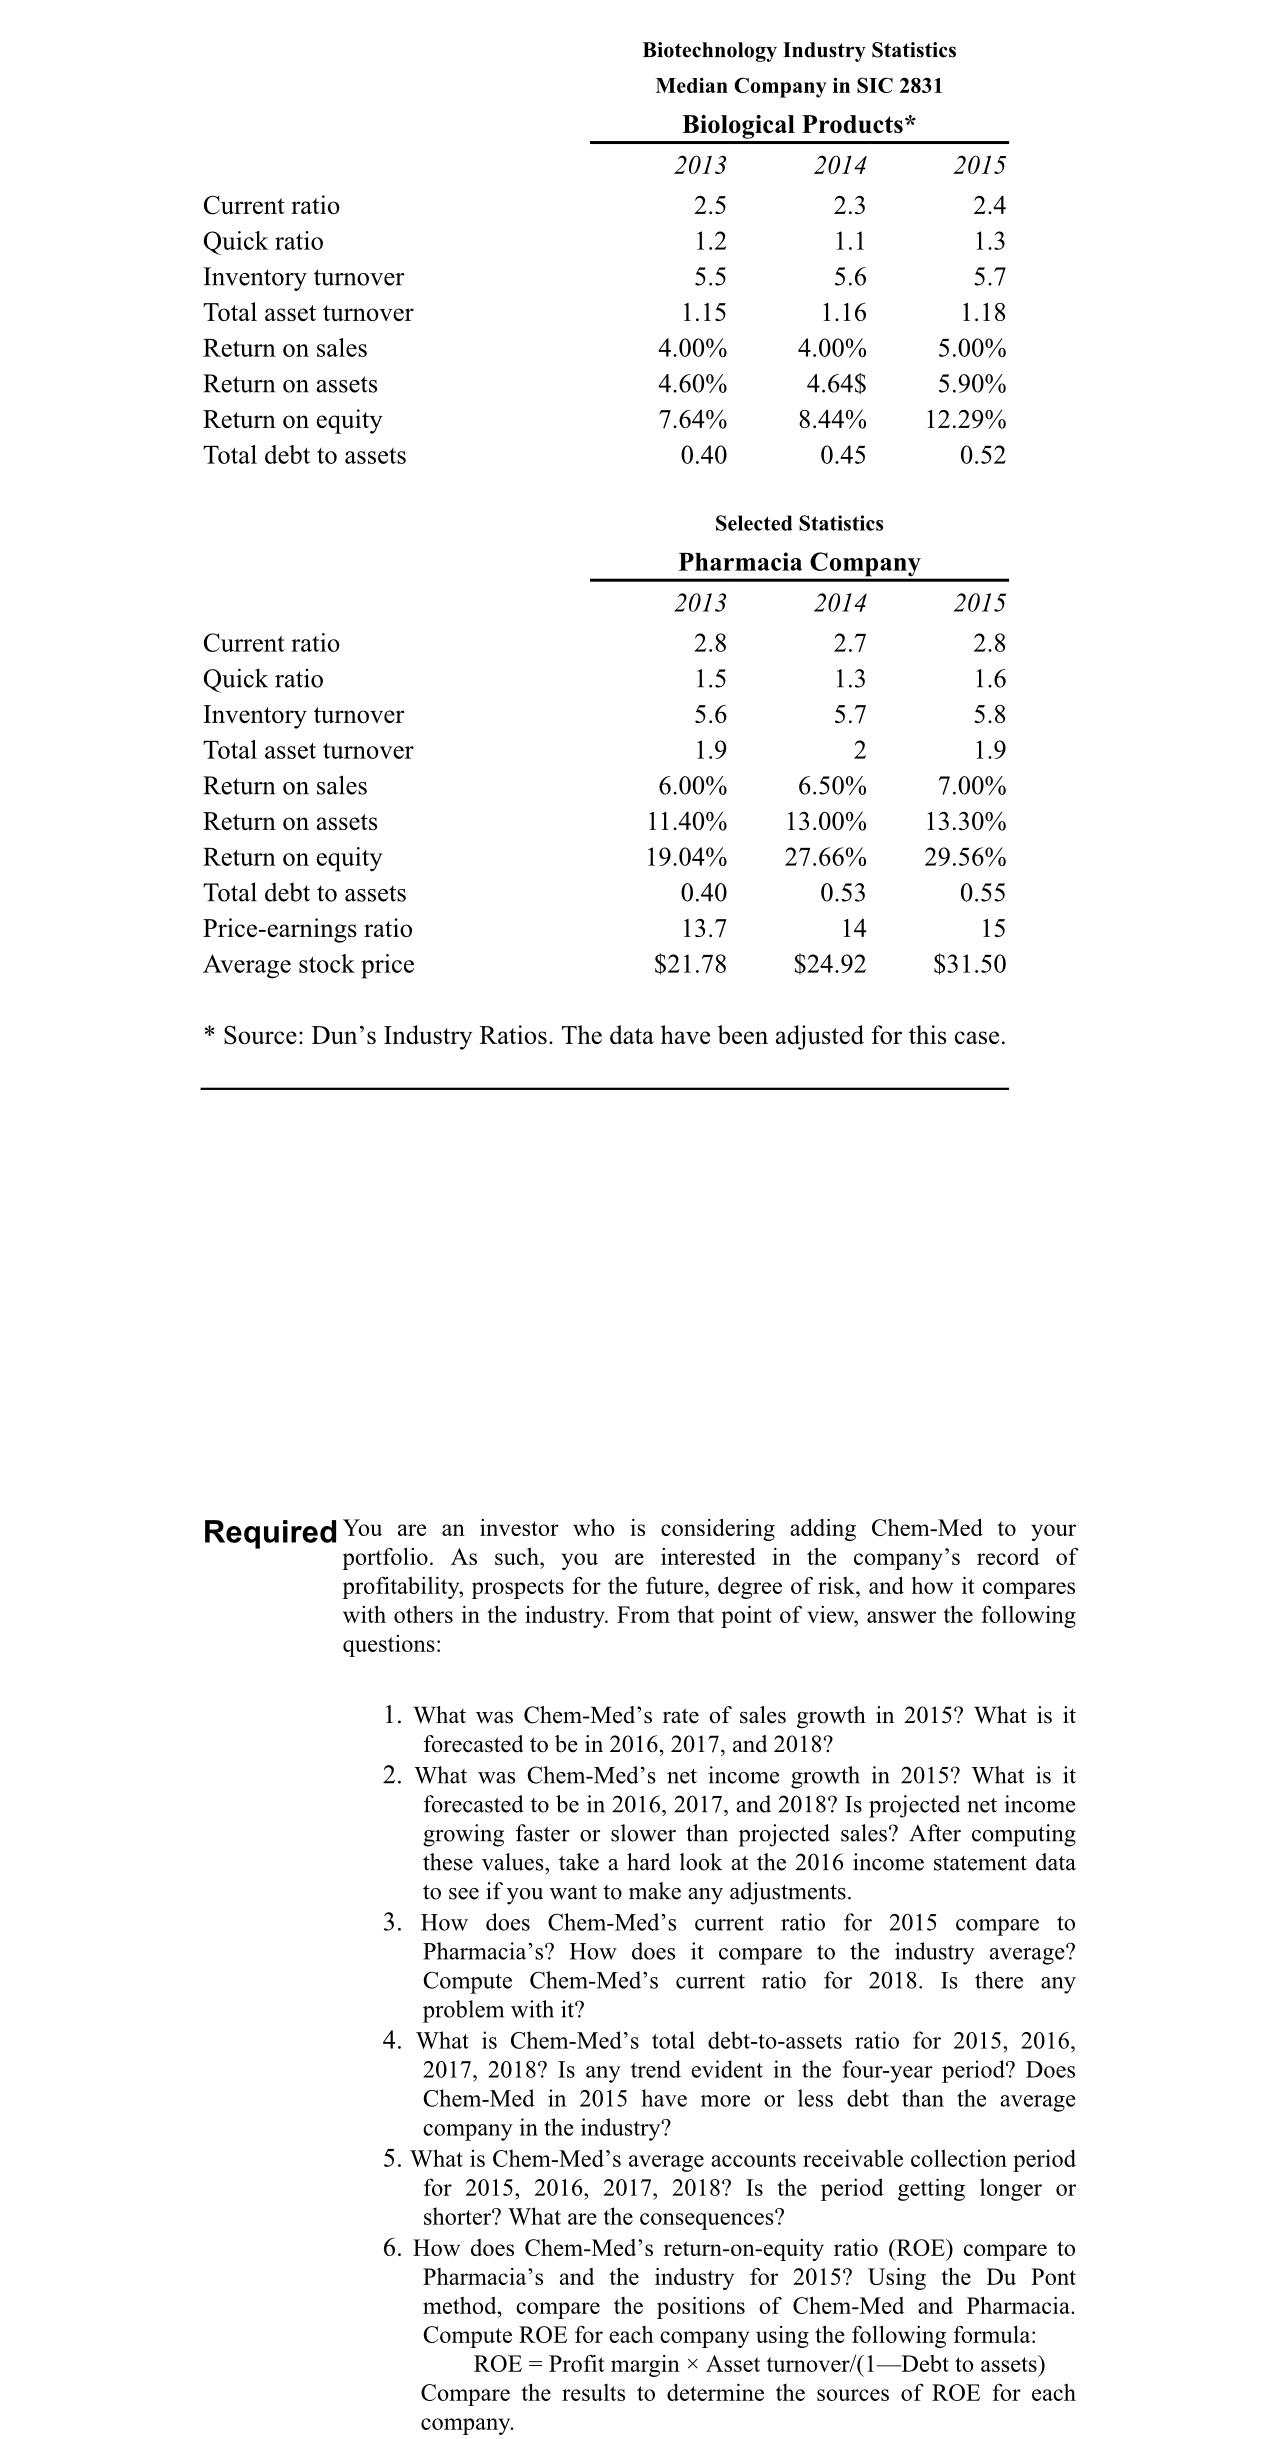
Current ratio Quick ratio Inventory turnover Total asset turnover Return on sales Return on assets. Return on equity Total debt to assets Current ratio Quick ratio Inventory turnover Total asset turnover Return on sales Return on assets Return on equity Total debt to assets Price-earnings ratio Average stock price Biotechnology Industry Statistics Median Company in SIC 2831 Biological Products* 2014 2.3 1.1 5.6 1.16 2013 2.5 1.2 5.5 1.15 4.00% 4.60% 7.64% 0.40 Selected Statistics Pharmacia Company 2014 2.7 1.3 5.7 2013 2.8 1.5 5.6 1.9 6.00% 11.40% 19.04% 4.00% 4.64$ 8.44% 0.45 0.40 13.7 $21.78 2 6.50% 13.00% 27.66% 0.53 14 $24.92 2015 2.4 1.3 5.7 1.18 5.00% 5.90% 12.29% 0.52 2015 2.8 1.6 5.8 1.9 7.00% 13.30% 29.56% 0.55 15 $31.50 * Source: Dun's Industry Ratios. The data have been adjusted for this case. Required You are an investor who is considering adding Chem-Med to your portfolio. As such, you are interested in the company's record of profitability, prospects for the future, degree of risk, and how it compares with others in the industry. From that point of view, answer the following questions: 1. What was Chem-Med's rate of sales growth in 2015? What is it forecasted to be in 2016, 2017, and 2018? 2. What was Chem-Med's net income growth in 2015? What is it forecasted to be in 2016, 2017, and 2018? Is projected net income growing faster or slower than projected sales? After computing these values, take a hard look at the 2016 income statement data to see if you want to make any adjustments. 3. How does Chem-Med's current ratio for 2015 compare to Pharmacia's? How does it compare to the industry average? Compute Chem-Med's current ratio for 2018. Is there any problem with it? 4. What is Chem-Med's total debt-to-assets ratio for 2015, 2016, 2017, 2018? Is any trend evident in the four-year period? Does Chem-Med in 2015 have more or less debt than the average company in the industry? 5. What is Chem-Med's average accounts receivable collection period for 2015, 2016, 2017, 2018? Is the period getting longer or shorter? What are the consequences? 6. How does Chem-Med's return-on-equity ratio (ROE) compare to Pharmacia's and the industry for 2015? Using the Du Pont method, compare the positions of Chem-Med and Pharmacia. Compute ROE for each company using the following formula: ROE = Profit margin x Asset turnover/(1-Debt to assets) Compare the results to determine the sources of ROE for each company.
Step by Step Solution
There are 3 Steps involved in it

Get step-by-step solutions from verified subject matter experts