

Question: Current this is what I'm working on I need help trying to figure out this problem. I think I'm have a good understanding of it
Current this is what I'm working on I need help trying to figure out this problem. I think I'm have a good understanding of it but I'm not sure.
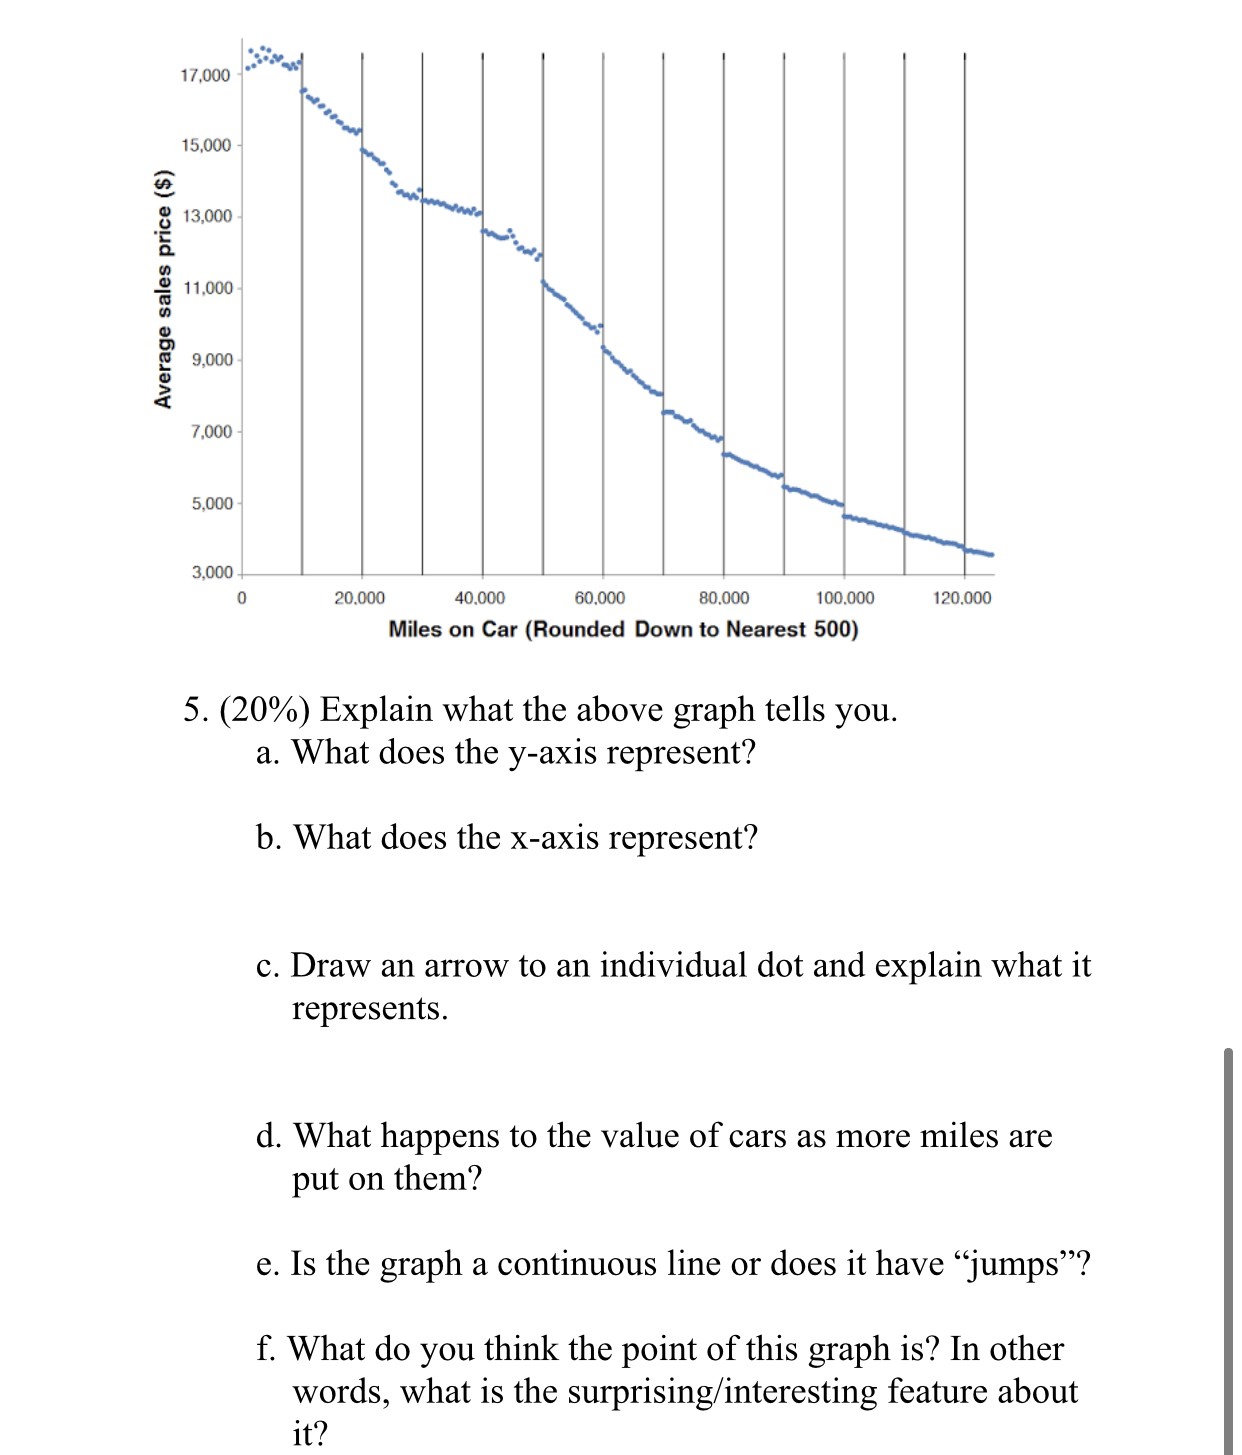
'3' 17.000 ' _| 5" I. E Average sales price (3) \"g 2 g 5.000 * 3,000 1 0 20.000 40.000 60.000 00.000 100.000 120.000 Miles on Car (Rounded Down to Nearest 500) 5. (20%) Explain what the above graph tells you. a. What does the y-axis represent? b. What does the x-axis represent? 0. Draw an arrow to an individual dot and explain what it represents. (1. What happens to the value of cars as more miles are put on them? e. Is the graph a continuous line or does it have \"jumps\"? f. What do you think the point of this graph is? In other words, what is the surprising/ interesting feature about it
Step by Step Solution
There are 3 Steps involved in it

Get step-by-step solutions from verified subject matter experts