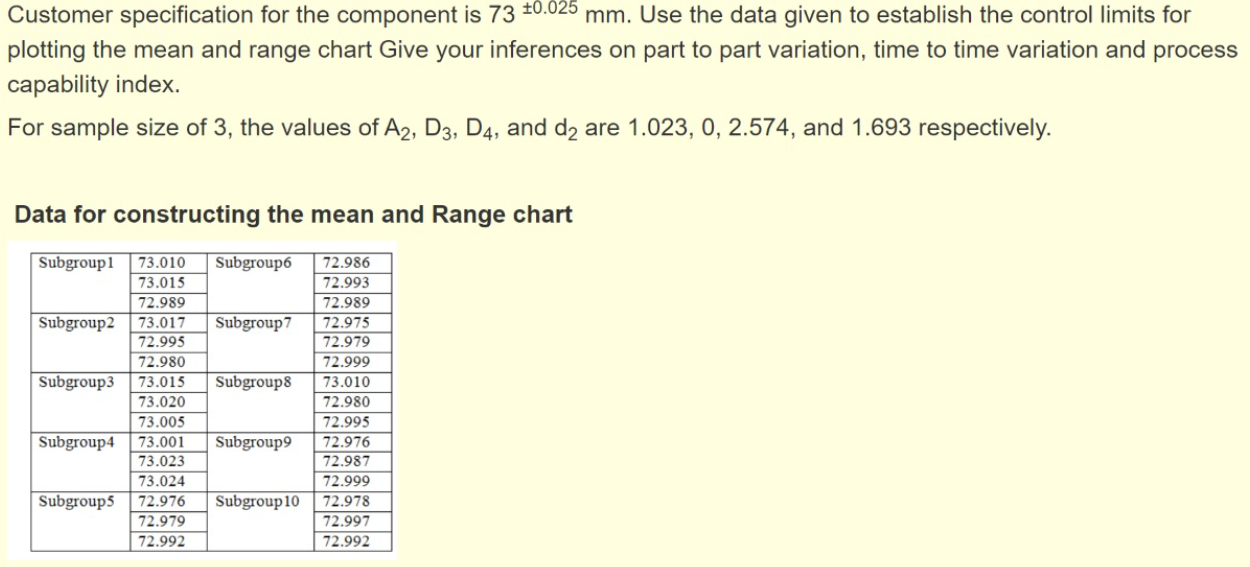
Question: Customer specification for the component is 73 +0.025 mm. Use the data given to establish the control limits for plotting the mean and range chart

Customer specification for the component is 73

Customer specification for the component is 73 +0.025 mm. Use the data given to establish the control limits for plotting the mean and range chart Give your inferences on part to part variation, time to time variation and process capability index. For sample size of 3, the values of A2, D3, D4, and d2 are 1.023, 0, 2.574, and 1.693 respectively. Data for constructing the mean and Range chart Subgroup1 Subgroup6 Subgroup2 Subgroup7 Subgroup3 Subgroups 73.010 73.015 72.989 73.017 72.995 72.980 73.015 73.020 73.005 73.001 73.023 73.024 72.976 72.979 72.992 72.986 72.993 72.989 72.975 72.979 72.999 73.010 72.980 72.995 72.976 72.987 72.999 72.978 72.997 72.992 Subgroup 4 Subgroup Subgroups Subgroup 10

Step by Step Solution

There are 3 Steps involved in it

1 Expert Approved Answer
Step: 1 Unlock blur-text-image
Question Has Been Solved by an Expert!

Get step-by-step solutions from verified subject matter experts

Step: 2 Unlock
Step: 3 Unlock

Students Have Also Explored These Related General Management Questions!