

Question: customers that return for the same repair within the 3 and graphs to illustrate how reliably its mechanics get under the hood and fix the
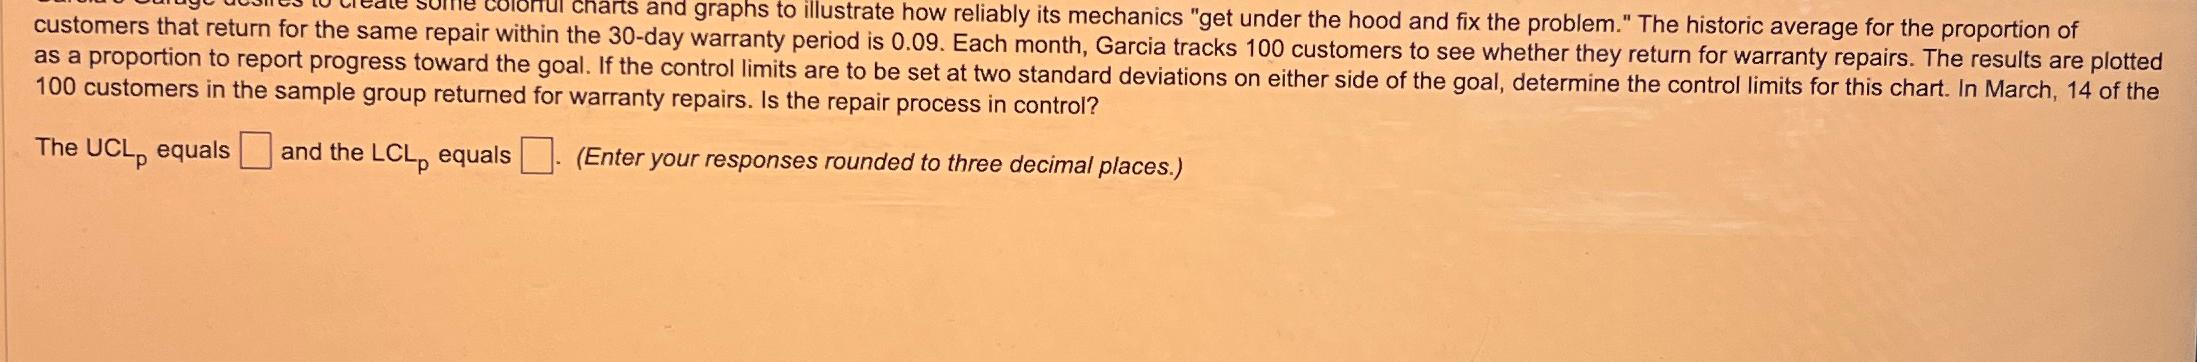
customers that return for the same repair within the and graphs to illustrate how reliably its mechanics "get under the hood and fix the problem." The historic average for the proportion of as a proportion to report progress toward the goal. If customers in the sample group returned for warranty repairs. Is the repair process in control?
The UCL equals and the equals Enter your responses rounded to three decimal places.
Step by Step Solution
There are 3 Steps involved in it
1 Expert Approved Answer
Step: 1 Unlock

Question Has Been Solved by an Expert!
Get step-by-step solutions from verified subject matter experts
Step: 2 Unlock
Step: 3 Unlock