Question: Answer is not 'E' Garcia's Garage desires to create some colorful charts and graphs to illustrate how reliably its mechanics get under the hood and
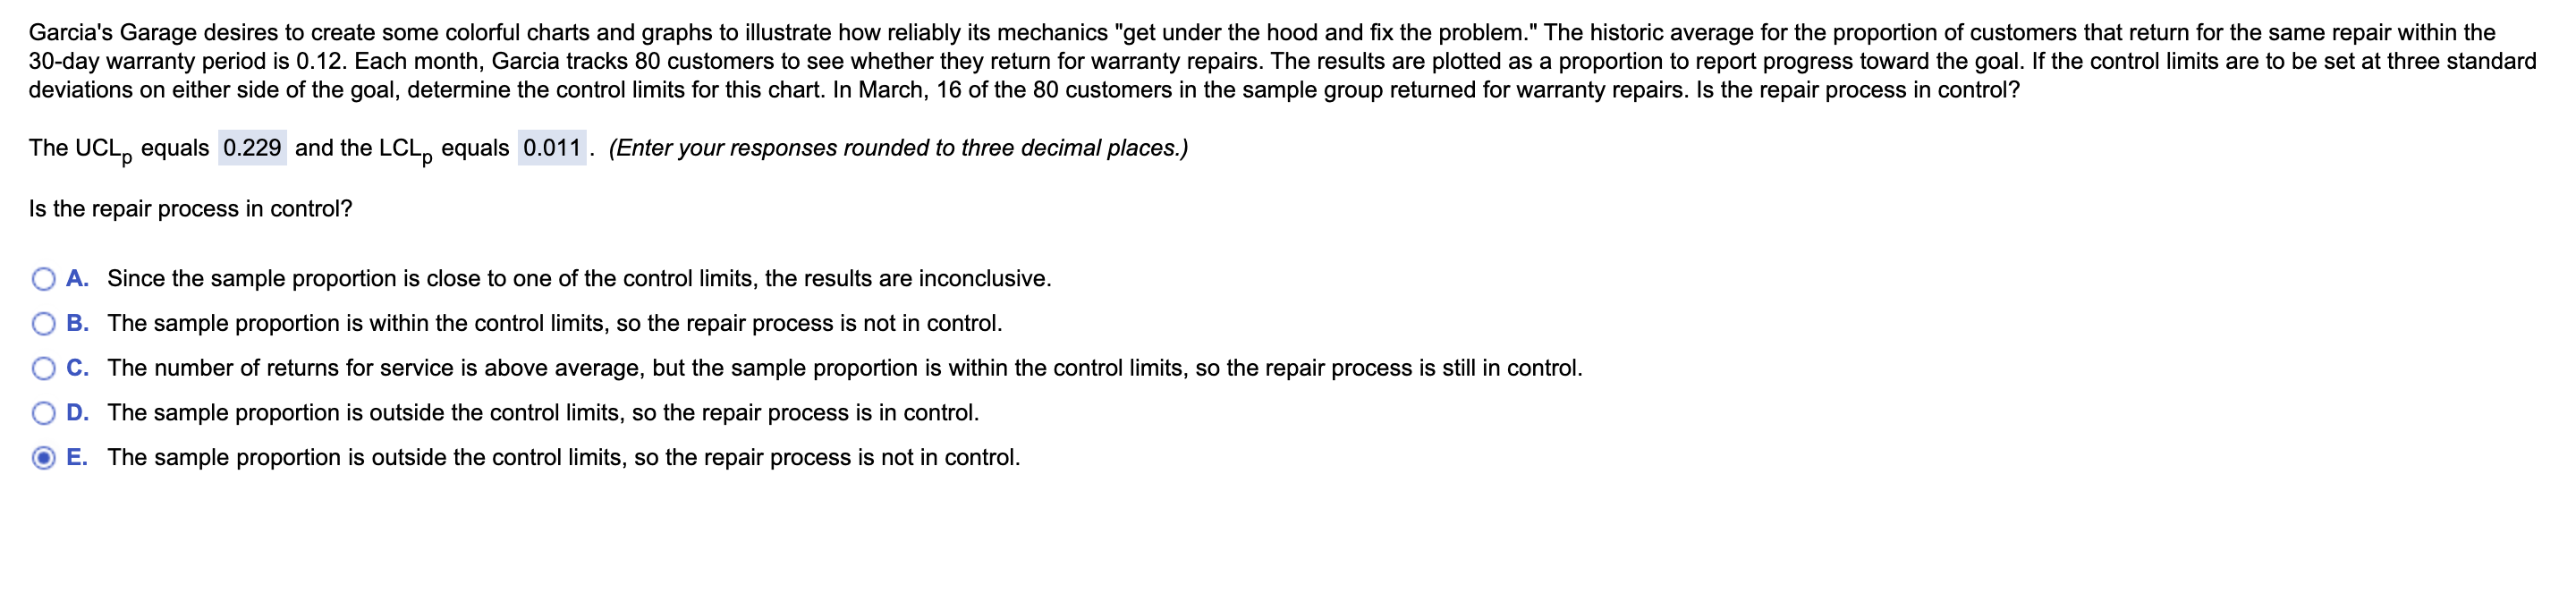
Answer is not 'E' Garcia's Garage desires toAnswer is not 'E'

Garcia's Garage desires to create some colorful charts and graphs to illustrate how reliably its mechanics "get under the hood and fix the problem." The historic average for the proportion of customers that return for the same repair within the 30-day warranty period is 0.12. Each month, Garcia tracks 80 customers to see whether they return for warranty repairs. The results are plotted as a proportion to report progress toward the goal. If the control limits are to be set at three standard deviations on either side of the goal, determine the control limits for this chart. In March, 16 of the 80 customers in the sample group returned for warranty repairs. Is the repair process in control? The UCLp equals 0.229 and the LCL equals 0.011. (Enter your responses rounded to three decimal places.) Is the repair process in control? A. Since the sample proportion is close to one of the control limits, the results are inconclusive. B. The sample proportion is within the control limits, so the repair process is not in control. C. The number of returns for service is above average, but the sample proportion is within the control limits, so the repair process is still in control. D. The imple proportion is outside the control limits, so the repair process is in control. E. The sample proportion is outside the control limits, so the repair process is not in control

Step by Step Solution

There are 3 Steps involved in it

1 Expert Approved Answer
Step: 1 Unlock blur-text-image
Question Has Been Solved by an Expert!

Get step-by-step solutions from verified subject matter experts

Step: 2 Unlock
Step: 3 Unlock

Students Have Also Explored These Related General Management Questions!