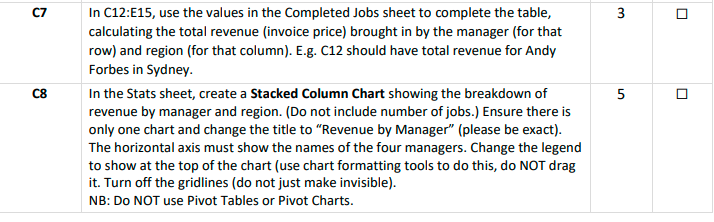
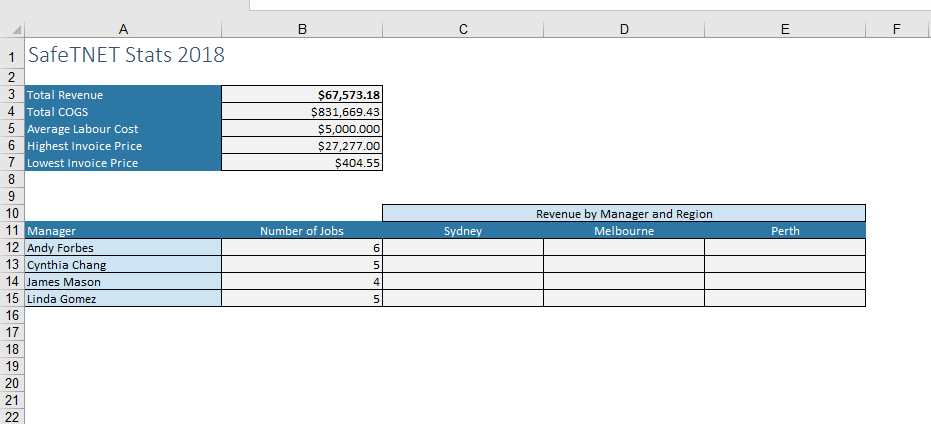
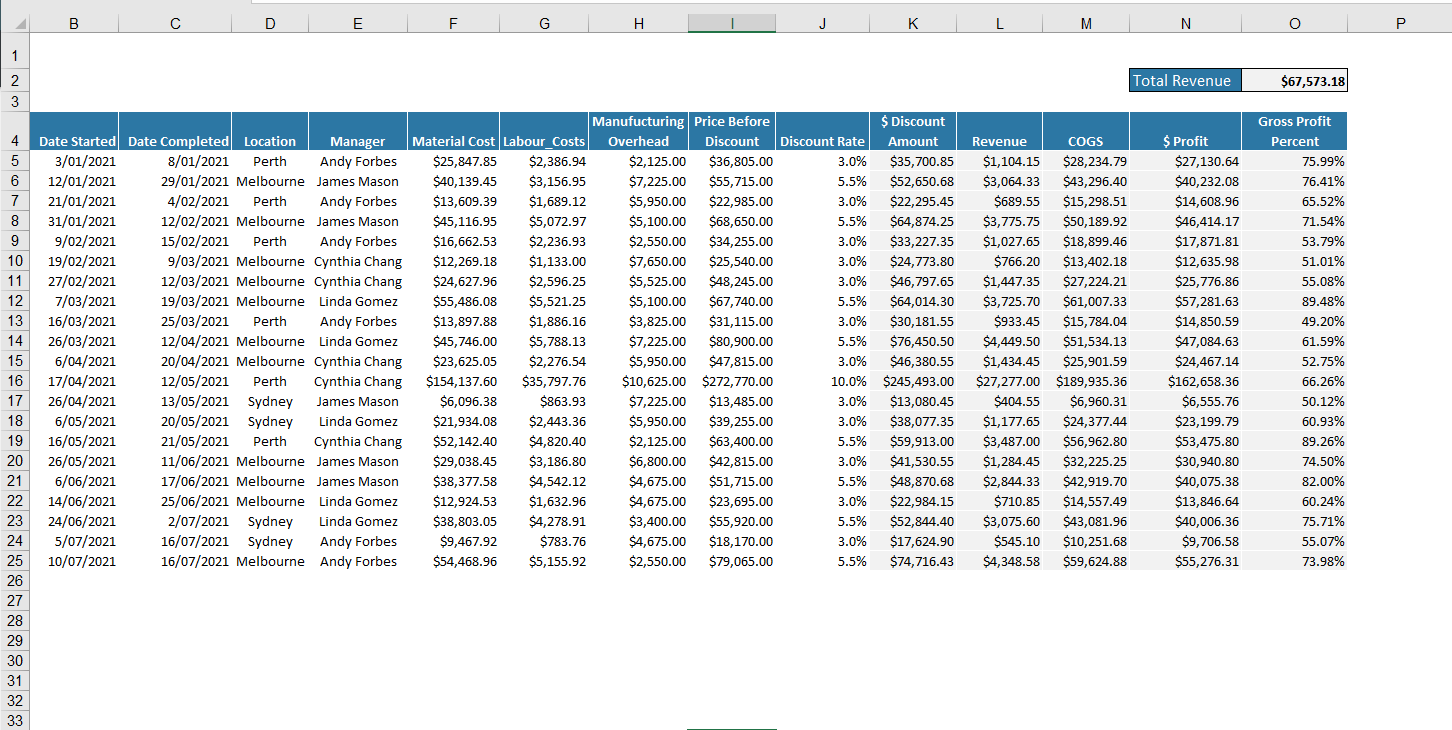
CZ 3 CS 5 In C12:E15, use the values in the Completed Jobs sheet to complete the table, calculating the total revenue (invoice price) brought in by the manager (for that row) and region (for that column). E.g. C12 should have total revenue for Andy Forbes in Sydney. In the Stats sheet, create a Stacked Column Chart showing the breakdown of revenue by manager and region. (Do not include number of jobs.) Ensure there is only one chart and change the title to "Revenue by Manager" (please be exact). The horizontal axis must show the names of the four managers. Change the legend to show at the top of the chart (use chart formatting tools to do this, do NOT drag it. Turn off the gridlines (do not just make invisible). NB: Do NOT use Pivot Tables or Pivot Charts. B D E F $67,573.18 $831,669.43 $5,000.000 $27,277.00 $404.55 A 1 SafeTNET Stats 2018 2 3 Total Revenue 4 Total COGS 5 Average Labour Cost 6 Highest Invoice Price 7 Lowest Invoice Price 8 9 10 11 Manager 12 Andy Forbes 13 Cynthia Chang 14 James Mason 15 Linda Gomez 16 17 18 19 20 21 22 Revenue by Manager and Region Melbourne Number of Jobs Sydney Perth 6 5 4 5 B D E F G H J K M N O 1 2 Total Revenue $67,573.18 3 Gross Profit Percent 75.99% 4 5 6 7 8 9 10 11 12 13 14 15 16 17 18 19 20 21 22 23 24 25 26 27 28 29 30 31 32 33 Date Started Date Completed Location Manager 3/01/2021 8/01/2021 Perth Andy Forbes 12/01/2021 29/01/2021 Melbourne James Mason 21/01/2021 4/02/2021 Perth Andy Forbes 31/01/2021 12/02/2021 Melbourne James Mason 9/02/2021 15/02/2021 Perth Andy Forbes 19/02/2021 9/03/2021 Melbourne Cynthia Chang 27/02/2021 12/03/2021 Melbourne Cynthia Chang 7/03/2021 19/03/2021 Melbourne Linda Gomez 16/03/2021 25/03/2021 Perth Andy Forbes 26/03/2021 12/04/2021 Melbourne Linda Gomez 6/04/2021 20/04/2021 Melbourne Cynthia Chang 17/04/2021 12/05/2021 Perth Cynthia Chang 26/04/2021 13/05/2021 Sydney James Mason 6/05/2021 20/05/2021 Sydney Linda Gomez 16/05/2021 21/05/2021 Perth Cynthia Chang 26/05/2021 11/06/2021 Melbourne James Mason 6/06/2021 17/06/2021 Melbourne James Mason 14/06/2021 25/06/2021 Melbourne Linda Gomez 24/06/2021 2/07/2021 Sydney Linda Gomez 5/07/2021 16/07/2021 Sydney Andy Forbes 10/07/2021 16/07/2021 Melbourne Andy Forbes Manufucturing Price Before Material Cost Labour Costs Overhead Discount Discount Rate $25,847.85 $2,386.94 $2,125.00 $36,805.00 3.0% $40,139.45 $3,156.95 $7,225.00 $55,715.00 5.5% $13,609.39 $1,689.12 $5,950.00 $22,985.00 3.0% $45,116.95 $5,072.97 $5,100.00 $68,650.00 5.5% $16,662.53 $2,236.93 $2,550.00 $34,255.00 3.0% $12,269.18 $1,133.00 $7,650.00 $25,540.00 3.0% $24,627.96 $2,596.25 $5,525.00 $48, 245.00 3.0% $55,486.08 $5,521.25 $5,100.00 $67,740.00 5.5% $13,897.88 $1,886.16 $3,825.00 $31,115.00 3.0% $45,746.00 $5,788.13 $7,225.00 $80,900.00 5.5% $23,625.05 $2,276.54 $5,950.00 $47,815.00 3.0% $154,137.60 $35,797.76 $10,625.00 $272,770.00 10.0% $6,096.38 $863.93 $7,225.00 $13,485.00 3.0% $21,934.08 $2,443.36 $5,950.00 $39,255.00 3.0% $52,142.40 $4,820.40 $2,125.00 $63,400.00 5.5% $29,038.45 $3,186.80 $6,800.00 $42,815.00 3.0% $38,377.58 $4,542.12 $4,675.00 $51,715.00 5.5% $12,924.53 $1,632.96 $4,675.00 $23,695.00 3.0% $38,803.05 $4,278.91 $3,400.00 $55,920.00 5.5% $9,467.92 $783.76 $4,675.00 $18,170.00 3.0% $54,468.96 $5,155.92 $2,550.00 $79,065.00 5.5% $ Discount Amount $35,700.85 $52,650.68 $22,295.45 $64,874.25 $33,227.35 $24,773.80 $46,797.65 $64,014.30 $30, 181.55 $76,450.50 $46,380.55 $245,493.00 $13,080.45 $38,077.35 $59,913.00 $41,530.55 $48,870.68 $22,984.15 $52,844.40 $17,624.90 $74,716.43 Revenue COGS $1,104.15 $28,234.79 $3,064.33 $43,296.40 $689.55 $15,298.51 $3,775.75 $50,189.92 $1,027.65 $18,899.46 $766.20 $13,402.18 $1,447.35 $27,224.21 $3,725.70 $61,007.33 $933.45 $15,784.04 $4,449.50 $51,534.13 $1,434.45 $25,901.59 $27,277.00 $189,935.36 $404.55 $6,960.31 $1,177.65 $24,377.44 $3,487.00 $56,962.80 $1,284.45 $32,225.25 $2,844.33 $42,919.70 $710.85 $14,557.49 $3,075.60 $43,081.96 $545.10 $10,251.68 $4,348.58 $59,624.88 $ Profit $27,130.64 $40,232.08 $14,608.96 $46,414.17 $17,871.81 $12,635.98 $25,776.86 $57,281.63 $14,850.59 $47,084.63 $24,467.14 $162,658.36 $6,555.76 $23,199.79 $53,475.80 $30,940.80 $40,075.38 $13,846.64 $40,006.36 $9,706.58 $55,276.31 76.41% 65.52% 71.54% 53.79% 51.01% 55.08% 89.48% 49.20% 61.59% 52.75% 66.26% 50.12% 60.93% 89.26% 74.50% 82.00% 60.24% 75.71% 55.07% 73.98% CZ 3 CS 5 In C12:E15, use the values in the Completed Jobs sheet to complete the table, calculating the total revenue (invoice price) brought in by the manager (for that row) and region (for that column). E.g. C12 should have total revenue for Andy Forbes in Sydney. In the Stats sheet, create a Stacked Column Chart showing the breakdown of revenue by manager and region. (Do not include number of jobs.) Ensure there is only one chart and change the title to "Revenue by Manager" (please be exact). The horizontal axis must show the names of the four managers. Change the legend to show at the top of the chart (use chart formatting tools to do this, do NOT drag it. Turn off the gridlines (do not just make invisible). NB: Do NOT use Pivot Tables or Pivot Charts. B D E F $67,573.18 $831,669.43 $5,000.000 $27,277.00 $404.55 A 1 SafeTNET Stats 2018 2 3 Total Revenue 4 Total COGS 5 Average Labour Cost 6 Highest Invoice Price 7 Lowest Invoice Price 8 9 10 11 Manager 12 Andy Forbes 13 Cynthia Chang 14 James Mason 15 Linda Gomez 16 17 18 19 20 21 22 Revenue by Manager and Region Melbourne Number of Jobs Sydney Perth 6 5 4 5 B D E F G H J K M N O 1 2 Total Revenue $67,573.18 3 Gross Profit Percent 75.99% 4 5 6 7 8 9 10 11 12 13 14 15 16 17 18 19 20 21 22 23 24 25 26 27 28 29 30 31 32 33 Date Started Date Completed Location Manager 3/01/2021 8/01/2021 Perth Andy Forbes 12/01/2021 29/01/2021 Melbourne James Mason 21/01/2021 4/02/2021 Perth Andy Forbes 31/01/2021 12/02/2021 Melbourne James Mason 9/02/2021 15/02/2021 Perth Andy Forbes 19/02/2021 9/03/2021 Melbourne Cynthia Chang 27/02/2021 12/03/2021 Melbourne Cynthia Chang 7/03/2021 19/03/2021 Melbourne Linda Gomez 16/03/2021 25/03/2021 Perth Andy Forbes 26/03/2021 12/04/2021 Melbourne Linda Gomez 6/04/2021 20/04/2021 Melbourne Cynthia Chang 17/04/2021 12/05/2021 Perth Cynthia Chang 26/04/2021 13/05/2021 Sydney James Mason 6/05/2021 20/05/2021 Sydney Linda Gomez 16/05/2021 21/05/2021 Perth Cynthia Chang 26/05/2021 11/06/2021 Melbourne James Mason 6/06/2021 17/06/2021 Melbourne James Mason 14/06/2021 25/06/2021 Melbourne Linda Gomez 24/06/2021 2/07/2021 Sydney Linda Gomez 5/07/2021 16/07/2021 Sydney Andy Forbes 10/07/2021 16/07/2021 Melbourne Andy Forbes Manufucturing Price Before Material Cost Labour Costs Overhead Discount Discount Rate $25,847.85 $2,386.94 $2,125.00 $36,805.00 3.0% $40,139.45 $3,156.95 $7,225.00 $55,715.00 5.5% $13,609.39 $1,689.12 $5,950.00 $22,985.00 3.0% $45,116.95 $5,072.97 $5,100.00 $68,650.00 5.5% $16,662.53 $2,236.93 $2,550.00 $34,255.00 3.0% $12,269.18 $1,133.00 $7,650.00 $25,540.00 3.0% $24,627.96 $2,596.25 $5,525.00 $48, 245.00 3.0% $55,486.08 $5,521.25 $5,100.00 $67,740.00 5.5% $13,897.88 $1,886.16 $3,825.00 $31,115.00 3.0% $45,746.00 $5,788.13 $7,225.00 $80,900.00 5.5% $23,625.05 $2,276.54 $5,950.00 $47,815.00 3.0% $154,137.60 $35,797.76 $10,625.00 $272,770.00 10.0% $6,096.38 $863.93 $7,225.00 $13,485.00 3.0% $21,934.08 $2,443.36 $5,950.00 $39,255.00 3.0% $52,142.40 $4,820.40 $2,125.00 $63,400.00 5.5% $29,038.45 $3,186.80 $6,800.00 $42,815.00 3.0% $38,377.58 $4,542.12 $4,675.00 $51,715.00 5.5% $12,924.53 $1,632.96 $4,675.00 $23,695.00 3.0% $38,803.05 $4,278.91 $3,400.00 $55,920.00 5.5% $9,467.92 $783.76 $4,675.00 $18,170.00 3.0% $54,468.96 $5,155.92 $2,550.00 $79,065.00 5.5% $ Discount Amount $35,700.85 $52,650.68 $22,295.45 $64,874.25 $33,227.35 $24,773.80 $46,797.65 $64,014.30 $30, 181.55 $76,450.50 $46,380.55 $245,493.00 $13,080.45 $38,077.35 $59,913.00 $41,530.55 $48,870.68 $22,984.15 $52,844.40 $17,624.90 $74,716.43 Revenue COGS $1,104.15 $28,234.79 $3,064.33 $43,296.40 $689.55 $15,298.51 $3,775.75 $50,189.92 $1,027.65 $18,899.46 $766.20 $13,402.18 $1,447.35 $27,224.21 $3,725.70 $61,007.33 $933.45 $15,784.04 $4,449.50 $51,534.13 $1,434.45 $25,901.59 $27,277.00 $189,935.36 $404.55 $6,960.31 $1,177.65 $24,377.44 $3,487.00 $56,962.80 $1,284.45 $32,225.25 $2,844.33 $42,919.70 $710.85 $14,557.49 $3,075.60 $43,081.96 $545.10 $10,251.68 $4,348.58 $59,624.88 $ Profit $27,130.64 $40,232.08 $14,608.96 $46,414.17 $17,871.81 $12,635.98 $25,776.86 $57,281.63 $14,850.59 $47,084.63 $24,467.14 $162,658.36 $6,555.76 $23,199.79 $53,475.80 $30,940.80 $40,075.38 $13,846.64 $40,006.36 $9,706.58 $55,276.31 76.41% 65.52% 71.54% 53.79% 51.01% 55.08% 89.48% 49.20% 61.59% 52.75% 66.26% 50.12% 60.93% 89.26% 74.50% 82.00% 60.24% 75.71% 55.07% 73.98%


