

Question: D Below is a control chart for a product with quality standards = 7.5 and o= 0.866. Sub group Sample 1 Sample 2 Sample 3
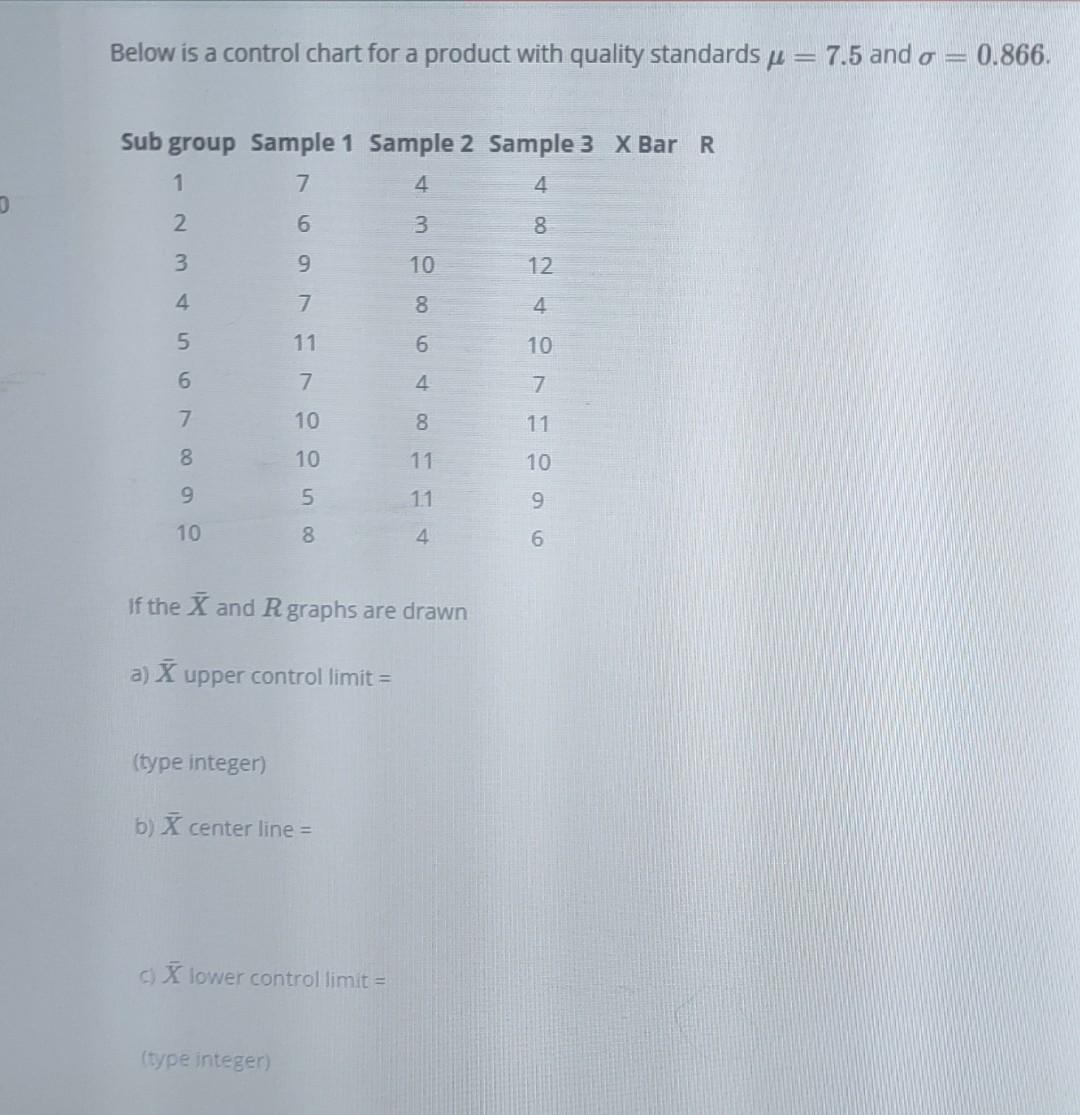
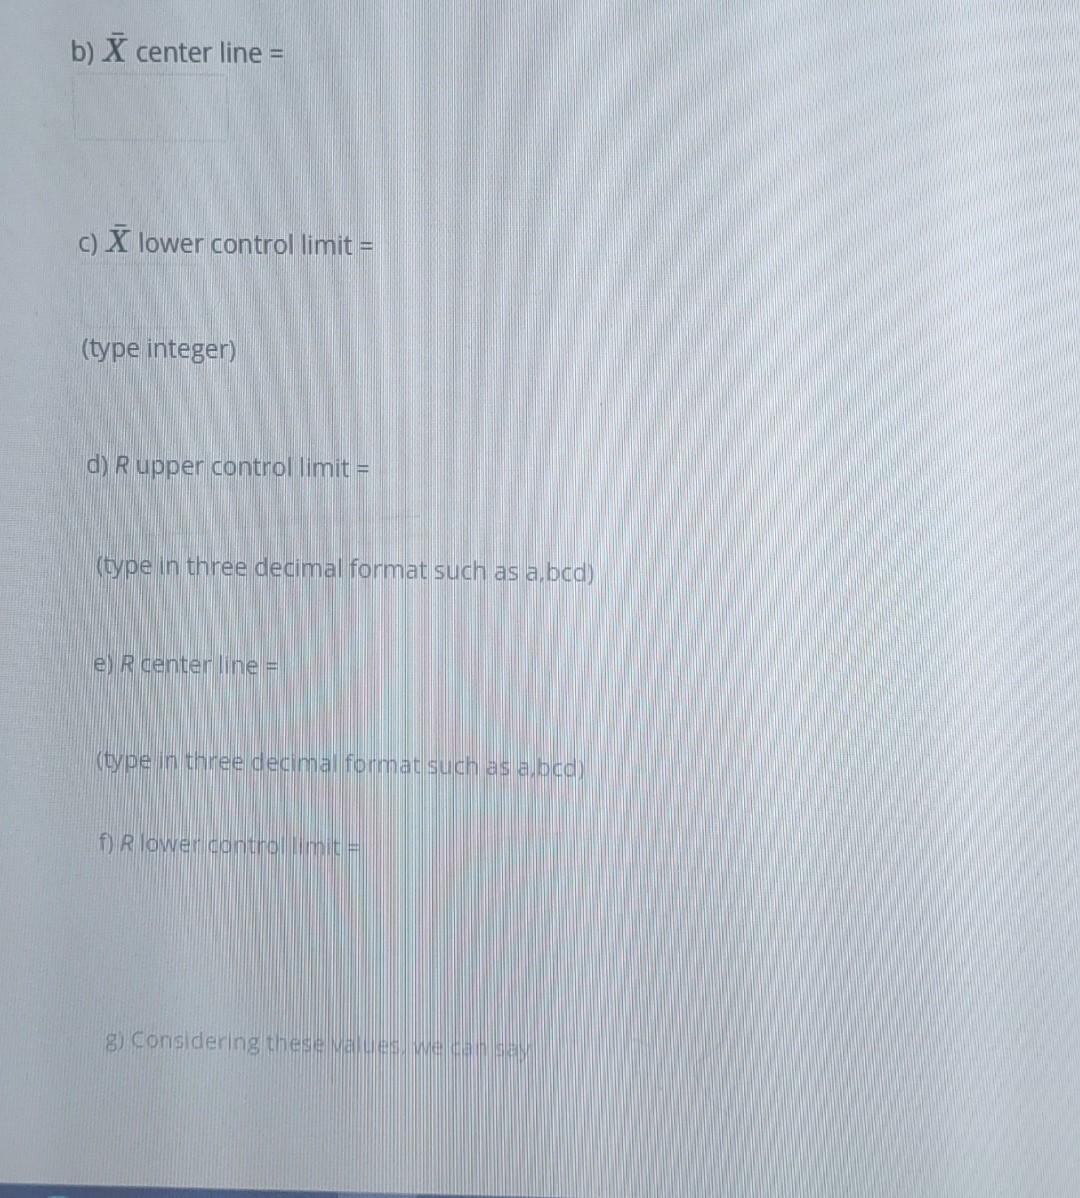
D Below is a control chart for a product with quality standards = 7.5 and o= 0.866. Sub group Sample 1 Sample 2 Sample 3 X Bar R 1 7 4 4 2 3 8 10 12 4 10 7 11 10 9 6 3 4 699 480006 5 11 6 7 7 10 8 10 9 5 10 8 If the X and Rgraphs are drawn a) X upper control limit= (type integer) b) X center line = c) X lower control limit= (type integer) 11 11 b) X center line = c) X lower control limit= (type integer) d) R upper control limit= (type in three decimal format such as a.bcd) e) R center line = (type in three decimal format such as a,bcd) f) R lower control limit=" g) Considering these values, we can say
Step by Step Solution
There are 3 Steps involved in it
1 Expert Approved Answer
Step: 1 Unlock

Question Has Been Solved by an Expert!
Get step-by-step solutions from verified subject matter experts
Step: 2 Unlock
Step: 3 Unlock