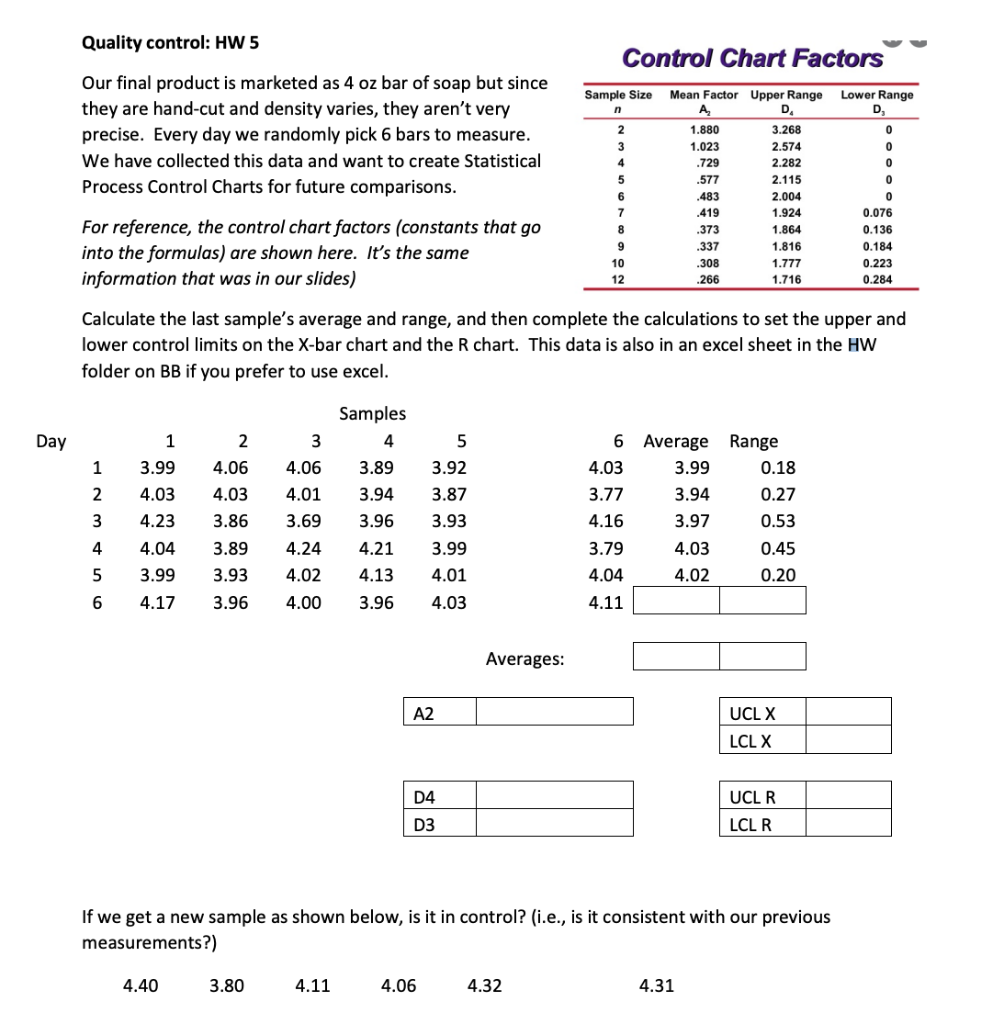
Question: Quality control: HW 5 Control Chart Factors Sample Size n Lower Range D Our final product is marketed as 4 oz bar of soap but

Quality control: HW 5 Control Chart Factors

Quality control: HW 5 Control Chart Factors Sample Size n Lower Range D Our final product is marketed as 4 oz bar of soap but since they are hand-cut and density varies, they aren't very precise. Every day we randomly pick 6 bars to measure. We have collected this data and want to create Statistical Process Control Charts for future comparisons. 0 4 Mean Factor Upper Range A D 1.880 3.268 1.023 2.574 .729 2.282 .577 2.115 .483 2.004 .419 1.924 .373 1.864 .337 1.816 .308 1.777 .266 1.716 For reference, the control chart factors (constants that go into the formulas) are shown here. It's the same information that was in our slides) 8 9 10 12 0.076 0.136 0.184 0.223 0.284 Calculate the last sample's average and range, and then complete the calculations to set the upper and lower control limits on the X-bar chart and the R chart. This data is also in an excel sheet in the HW folder on BB if you prefer to use excel. Day 3 4.06 1 1 3.99 4.03 4.23 2 3 2 4.06 4.03 3.86 3.89 3.93 3.96 Samples 4 3.89 3.94 3.96 4.21 4.13 3.96 5 3.92 3.87 3.93 3.99 4.01 4.01 3.69 4.24 4.02 4.00 6 Average Range 4.03 3.99 0.18 3.77 3.94 0.27 4.16 3.97 0.53 3.79 4.03 0.45 4.04 4.02 0.20 4.11 4 4.04 3.99 4.17 5 6 4.03 Averages: A2 UCL X LCL X D4 D3 UCL R LCL R If we get a new sample as shown below, is it in control? (i.e., is it consistent with our previous measurements?) 4.40 3.80 4.11 4.06 4.32 4.31

Step by Step Solution

There are 3 Steps involved in it

1 Expert Approved Answer
Step: 1 Unlock blur-text-image
Question Has Been Solved by an Expert!

Get step-by-step solutions from verified subject matter experts

Step: 2 Unlock
Step: 3 Unlock

Students Have Also Explored These Related General Management Questions!