

Question: ( d ) BOD test results are given below, plot - l n ( L ( t ) L 0 ) vs . time. You
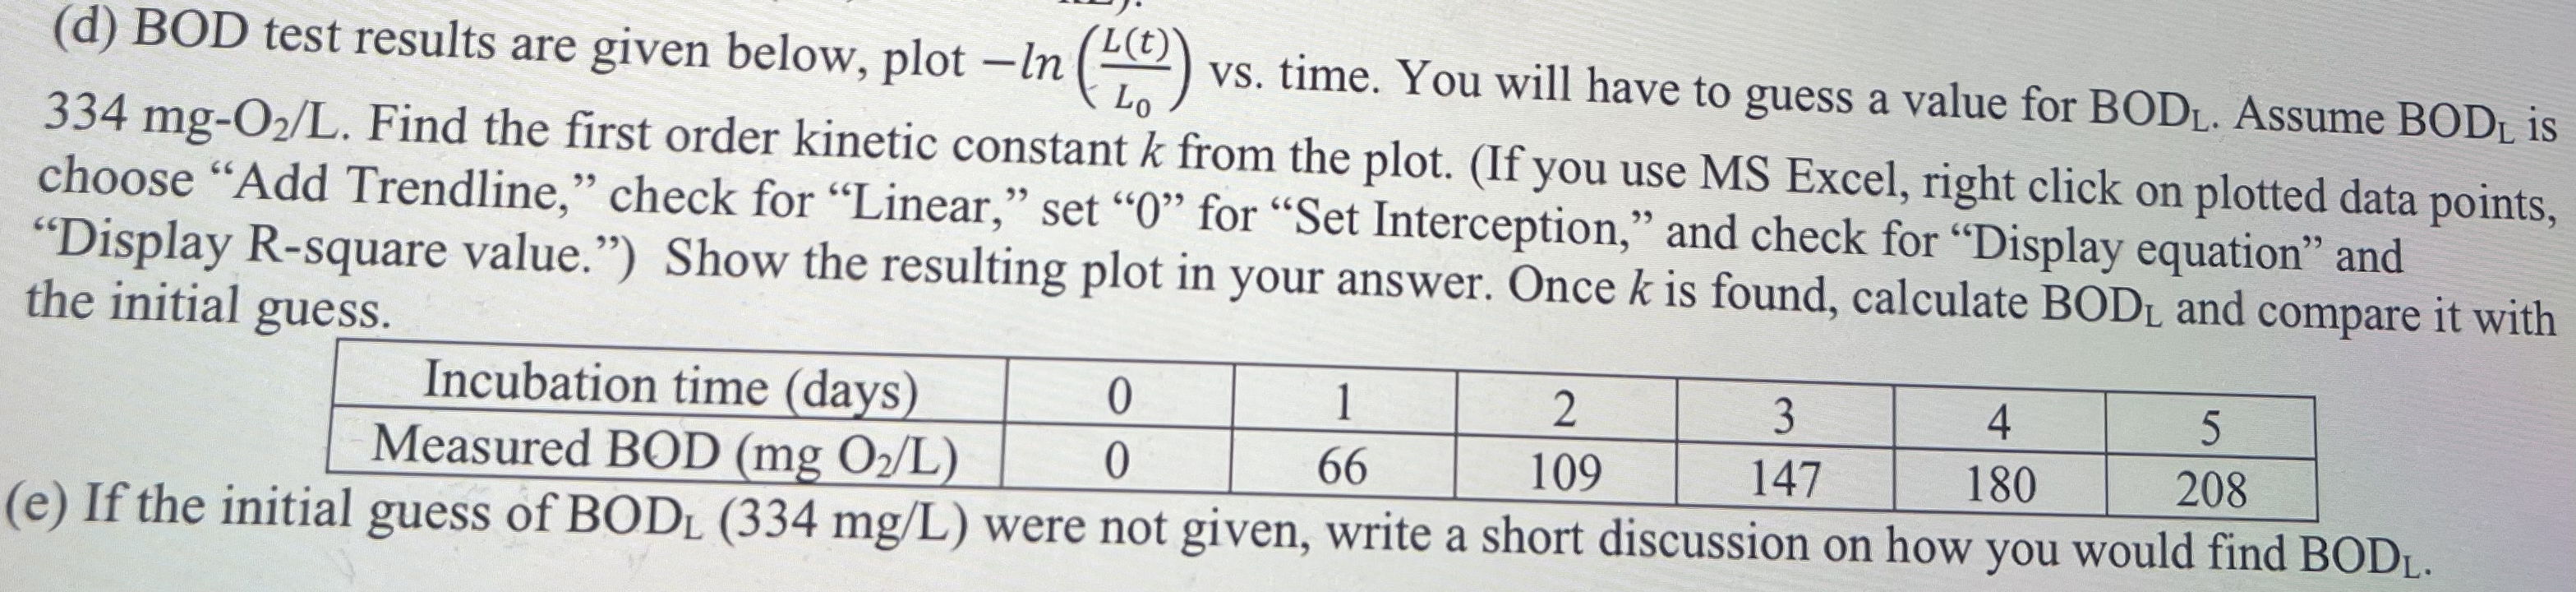
d BOD test results are given below, plot vs time. You will have to guess a value for Assume is Find the first order kinetic constant from the plot. If you use MS Excel, right click on plotted data points, choose "Add Trendline," check for "Linear," set for "Set Interception," and check for "Display equation" and "Display Rsquare value." Show the resulting plot in your answer. Once is found, calculate and compare it with the initial guess.
tableIncubation time daysMeasured BOD
e If the initial guess of were not given, write a short discussion on how you would find
Step by Step Solution
There are 3 Steps involved in it
1 Expert Approved Answer
Step: 1 Unlock

Question Has Been Solved by an Expert!
Get step-by-step solutions from verified subject matter experts
Step: 2 Unlock
Step: 3 Unlock