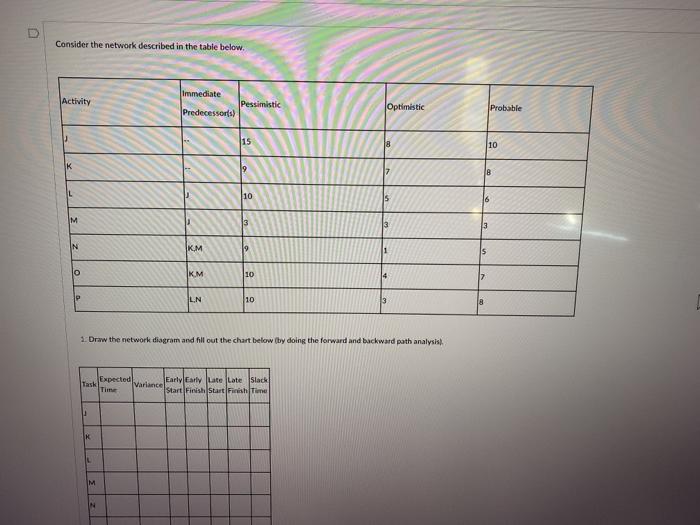
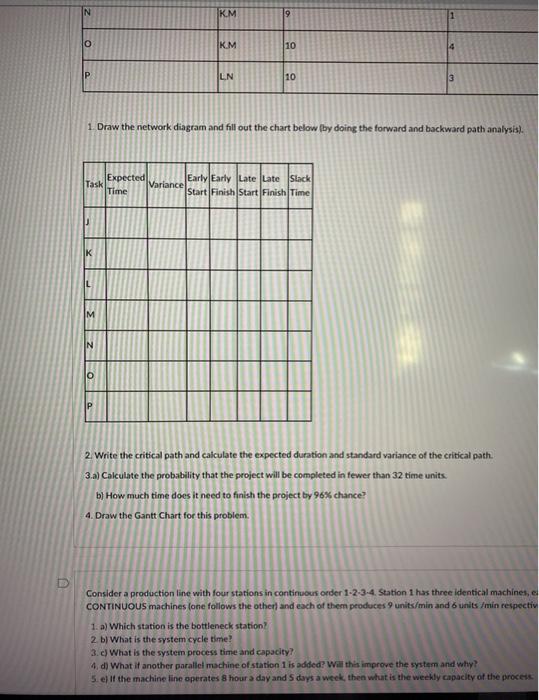
Question: D Consider the network described in the table below. Activity Immediate Pessimistic Predecessors) Optimistic Probable 15 18 10 K 19 17 B L 10 15

D Consider the network described in the table
D Consider the network described in the table below. Activity Immediate Pessimistic Predecessors) Optimistic Probable 15 18 10 K 19 17 B L 10 15 16 M 13 3 3 IN | KM 19 1 10 KM 10 14 7 IP ILN 10 3 1. Draw the network diagram and hill out the chart below by doing the forward and backward path analysis), Task Expected Variance Early Early Late Late Slack Start Finish start in Time K | N KM 19 o KM 10 IP LN 10 3 1 Draw the network diagram and fill out the chart below (by doing the forward and backward path analysis). Expected Early Early Late Late Slack Task Variance Time Start Finish Start Finish Time IK L | N O P 2. Write the critical path and calculate the expected duration and standard variance of the critical path. 3.a) Calculate the probability that the project will be completed in fewer than 32 time units. b) How much time does it need to finish the project by 96% chance? 4. Draw the Gantt Chart for this problem. Consider a production line with four stations in continuous order 1-2-3-4 Station 1 has three identical machines, CONTINUOUS machines (one follows the other) and each of them produces 9 units/min and 6 units /min respectiv 1. a) Which station is the bottleneck station? 2 b) What is the system cycle time! 3.) What is the system process time and capacity? 4. d) What if another parallel machine of station 1 is added? Will this improve the system and why? 5. e) If the machine line operates 8 hour a day and 5 days a week, then what is the weekly capacity of the process Arhively: the other line has only one machine producing a unit/min Station 1 al Which station is the bottleneck station? 2.b) What is the system cycle time? 3. What is the system process time and capacity? 4. What if another parallel machine of station 1 is added? Will this improve the system and why? 5.e) if the machine line operates 8 hour a day and 5 days a week, then what is the weekly capacity of the process. department at a local department store has tracked the sites of a product over the last five weeks Period Demand A. 1 24 12 23 3 125 14 35 15 26 al What is the forecast for Week 6 based on a weighted moving average led to the following past demands and using the weight and * Forecast dendung exponential smoothing with an oa of 0.2 and an initial forecast of 22.0 for pred 3. Calculate any two of MAD, MSE, and MAPE

Step by Step Solution

There are 3 Steps involved in it

1 Expert Approved Answer
Step: 1 Unlock blur-text-image
Question Has Been Solved by an Expert!

Get step-by-step solutions from verified subject matter experts

Step: 2 Unlock
Step: 3 Unlock

Students Have Also Explored These Related General Management Questions!