

Question: D E F G M 1 K M N O P in MillionsExcept Per Share Ant Years from New Apron 0.25 2000 1.25 2001 2.25
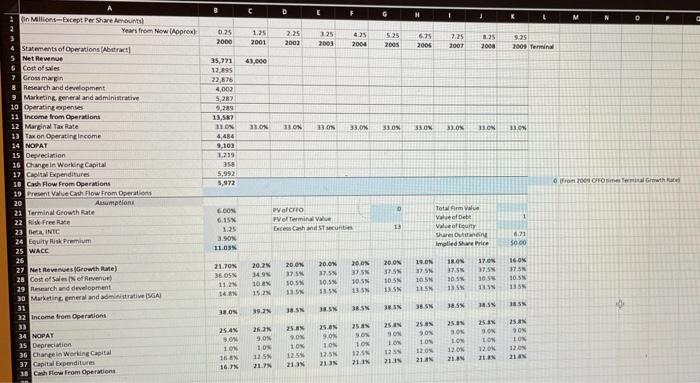
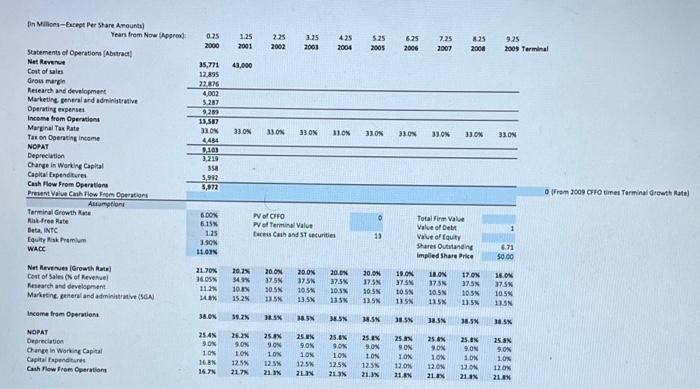
D E F G M 1 K M N O P in MillionsExcept Per Share Ant Years from New Apron 0.25 2000 1.25 2001 2.25 2002 125 2003 4.25 2004 5 25 2005 6.25 2006 7.25 2007 125 2008 9.25 2009 Terminal 41.000 35,771 12.95 22,876 4,002 527 9,285 13.587 BON 4.484 9,103 1.219 350 5,992 5,972 ON ON 23.04 33.ON 33.0 33.0 30% BON 33.0 from 2001 Orowth Statements of Operations Abstract] Net Rewe Cost of sales 7 Gross margin & Research and development 9 Marketing general and administrative 20 Operating openses 11 Income from Operations 12 Marginal Tax Rate 13 Taxon Operating Income 14 NOPAT 15 Depreciation 16 Change in Working Capital 17 Capital Expenditures IB Cash Flow From Operations 19 Presente Cash Flow From Operations 20 Autumpeion 21 Terminal Growth Rate 22 Risk Frete 23 , INTC 24 Equity Risk Premium 25 WACC 26 27 Net Revents Growth rate) 28 com of Sales of Revenue 29 Research and development 30 Marketing er and administrative SGA 31 32 income from Operations 33 34 NOPAY 25 Depreciation 36 Change in Working Capital 37 Capital Expenditures 38 Cash Flow From Operations 0 BON 6.15 1.25 3.90 11.035 W| CHV0 Fof Terminale ces Cash and stunt 1 13 Total Firm Value Veeft Valvelut Share Out imated Share Price 6.71 3000 21.70 36 OSX 11 14N 20.2 149 100 15.2 20.00 37.5 10.5 13 20.0N 37.5 10.5 335 20 ON 37. 10 SS 13 20 ON 37.5 10. 1SN 19.0N 375 10 N IN 180N 37.5 30 SN 135 37. 37.5 30 UN 16ON 175N 105 183 IN 38SN SN 38 IN BSN 18SN IN 3.ON 39 N 38.5 25.AN 9 10 16 EN 16. 26. 9.0 1 ON 12 5 21.7N 25.0N ON LON 125 21 IN 25.AN 9.ON 10 12.5 21 IN 25.4 SON 1ON 125 25 N SON 10 12 31 25 ON ON 105 120 21 25.IN SON LON 120 21 253 9.ON ION 12 ON UN 25N 90 LON 120 2N 213 0.25 2000 1.25 2001 2.25 2002 3.25 2001 425 2004 7.25 5.25 2005 6.25 2006 3.25 2008 9.25 2009 Terminal 2007 43,000 35,771 12.895 22.876 4.002 5287 9200 33.ON in Million-Except Per Share Amounts) Years from Now Approx Statements of Operations Abstract Net Revenue Cost of sales Grous margin Research and development Marketing general and administrative Operating expenses Income from Operation Marginal Tax Rate Tax on Operating income NOPAT Deprecation Change in Working Capital Capital Expenditures Cash Flow From Operations Present Value Cash Flow From Operations Alumni Terminal Growth Rae Rike free Rate Beta,INTC Equity Risk Premium WACC 330N 330N 31.ON 33.ON 330 JON 33.ON 33.ON 13.507 330N 4434 101 2.219 354 5,912 5,972 From 2009 CFO mes Terminal Growth Rata) 0 8.DON 6.15 1.25 1.SON 11.01 PV of CHFO Ne Yarmina Value e Cain and ST Securities 13 TotalFirm Value Value of Debt Vol Equity Shares Outstanding implied Share Price 671 $0.00 10.0 Net Revenue Growth Rae Cost of Sales (of Revenue Research and development Marketing general and administrative (GA Income from Operations 21.70% 16.03% 11.3 34X 20.3 34 10 EN 15.2 200N 17.5N 305 11.5 20.0N 375 10.51 13.5X 20.0 37.5 20.5 135 20.0 17.5 105N 12.5 375 10 SN 1SN 100N 37 SN 105N 11.5 17.0 37.SN 105N 1SN 16.ON 37.5% 1055 11SN 38.ON 30.2% HEIN BAN 3.N 1.5 38.5 JEN 105N 10.5 25. 30% NOPAT Depreciation Change in Working Capital Capital Expenditures Cash Flow From Operation 25.4 90% 101 163 16.7% 25.8% S.ON 26.2% SON 10 12.5% 217 25. 90N 10X 125 21.3% 25. 9.0% 10N 12.5% LIN 25.0 9.0% 1.09 125 213 25. AN 9 ON 10% 25 % SON LON 12.0N 21 X LON 125 21.3 25. 9.ON 1.DK 12.0 21 AN 10 1108 21.8% 120 21 EN D E F G M 1 K M N O P in MillionsExcept Per Share Ant Years from New Apron 0.25 2000 1.25 2001 2.25 2002 125 2003 4.25 2004 5 25 2005 6.25 2006 7.25 2007 125 2008 9.25 2009 Terminal 41.000 35,771 12.95 22,876 4,002 527 9,285 13.587 BON 4.484 9,103 1.219 350 5,992 5,972 ON ON 23.04 33.ON 33.0 33.0 30% BON 33.0 from 2001 Orowth Statements of Operations Abstract] Net Rewe Cost of sales 7 Gross margin & Research and development 9 Marketing general and administrative 20 Operating openses 11 Income from Operations 12 Marginal Tax Rate 13 Taxon Operating Income 14 NOPAT 15 Depreciation 16 Change in Working Capital 17 Capital Expenditures IB Cash Flow From Operations 19 Presente Cash Flow From Operations 20 Autumpeion 21 Terminal Growth Rate 22 Risk Frete 23 , INTC 24 Equity Risk Premium 25 WACC 26 27 Net Revents Growth rate) 28 com of Sales of Revenue 29 Research and development 30 Marketing er and administrative SGA 31 32 income from Operations 33 34 NOPAY 25 Depreciation 36 Change in Working Capital 37 Capital Expenditures 38 Cash Flow From Operations 0 BON 6.15 1.25 3.90 11.035 W| CHV0 Fof Terminale ces Cash and stunt 1 13 Total Firm Value Veeft Valvelut Share Out imated Share Price 6.71 3000 21.70 36 OSX 11 14N 20.2 149 100 15.2 20.00 37.5 10.5 13 20.0N 37.5 10.5 335 20 ON 37. 10 SS 13 20 ON 37.5 10. 1SN 19.0N 375 10 N IN 180N 37.5 30 SN 135 37. 37.5 30 UN 16ON 175N 105 183 IN 38SN SN 38 IN BSN 18SN IN 3.ON 39 N 38.5 25.AN 9 10 16 EN 16. 26. 9.0 1 ON 12 5 21.7N 25.0N ON LON 125 21 IN 25.AN 9.ON 10 12.5 21 IN 25.4 SON 1ON 125 25 N SON 10 12 31 25 ON ON 105 120 21 25.IN SON LON 120 21 253 9.ON ION 12 ON UN 25N 90 LON 120 2N 213 0.25 2000 1.25 2001 2.25 2002 3.25 2001 425 2004 7.25 5.25 2005 6.25 2006 3.25 2008 9.25 2009 Terminal 2007 43,000 35,771 12.895 22.876 4.002 5287 9200 33.ON in Million-Except Per Share Amounts) Years from Now Approx Statements of Operations Abstract Net Revenue Cost of sales Grous margin Research and development Marketing general and administrative Operating expenses Income from Operation Marginal Tax Rate Tax on Operating income NOPAT Deprecation Change in Working Capital Capital Expenditures Cash Flow From Operations Present Value Cash Flow From Operations Alumni Terminal Growth Rae Rike free Rate Beta,INTC Equity Risk Premium WACC 330N 330N 31.ON 33.ON 330 JON 33.ON 33.ON 13.507 330N 4434 101 2.219 354 5,912 5,972 From 2009 CFO mes Terminal Growth Rata) 0 8.DON 6.15 1.25 1.SON 11.01 PV of CHFO Ne Yarmina Value e Cain and ST Securities 13 TotalFirm Value Value of Debt Vol Equity Shares Outstanding implied Share Price 671 $0.00 10.0 Net Revenue Growth Rae Cost of Sales (of Revenue Research and development Marketing general and administrative (GA Income from Operations 21.70% 16.03% 11.3 34X 20.3 34 10 EN 15.2 200N 17.5N 305 11.5 20.0N 375 10.51 13.5X 20.0 37.5 20.5 135 20.0 17.5 105N 12.5 375 10 SN 1SN 100N 37 SN 105N 11.5 17.0 37.SN 105N 1SN 16.ON 37.5% 1055 11SN 38.ON 30.2% HEIN BAN 3.N 1.5 38.5 JEN 105N 10.5 25. 30% NOPAT Depreciation Change in Working Capital Capital Expenditures Cash Flow From Operation 25.4 90% 101 163 16.7% 25.8% S.ON 26.2% SON 10 12.5% 217 25. 90N 10X 125 21.3% 25. 9.0% 10N 12.5% LIN 25.0 9.0% 1.09 125 213 25. AN 9 ON 10% 25 % SON LON 12.0N 21 X LON 125 21.3 25. 9.ON 1.DK 12.0 21 AN 10 1108 21.8% 120 21 EN
Step by Step Solution
There are 3 Steps involved in it

Get step-by-step solutions from verified subject matter experts